
Data Metrics & Results
BAWR Reporting Sites and Target Population
BAWR Reporting Organizations are owned by the DOE-operated facilities with current employees who:
- Have been exposed, or have had the potential for exposure, to airborne concentrations of beryllium due to their work at the present or a previous DOE site;
- Self-identify and indicate a history of possible exposure; or
- Exhibit symptoms of beryllium exposure, or are receiving medical removal protection benefits.
The site’s CBDPP may also include other employees in the BAWR reporting for their site, as appropriate. Subcontractors who are not included under the main site’s CBDPP must have their own CBDPP and report data separately. The 10 CFR 850 (view report; page 6931) contains further information on beryllium and beryllium-associated workers, and which organizations should have CBDPPs.
Through the 2019 calendar, the BAWR received data from the following 27 DOE-affiliated reporting organizations:
- Ames Laboratory (AMES)
- Argonne National Laboratory (ANL)
- Brookhaven National Laboratory (BNL)
- DOE Oak Ridge Office (DOE-ORO)
- East Tennessee Technology Park (ETTP)
- Fermi National Accelerator Laboratory (Fermi)
- Golden SVCS, LLC (GSVCS)
- Hanford Site (HAN)
- Idaho National Laboratory (INL)
- Kansas City National Security Campus (KCNSC)
- Knolls Atomic Power Laboratory (KAPL)
- Lawrence Berkeley National Laboratory (LBNL)
- Lawrence Livermore National Laboratory (LLNL)
- LLNL Clean Harbors Environmental Services (LLNL CHES)
- LLNL NW (LLNL NW)
- Los Alamos National Laboratory (LANL)
- Nevada National Security Site (NNSS)
- Oak Ridge National Laboratory (ORNL)
- Pacific Northwest National Laboratory (PNNL)
- Paducah Site (PADUCAH)
- Pantex Plant (PTX)
- Sandia National Laboratories (SNL)
- Savannah River Site (SRS)
- SLAC National Accelerator Laboratory (SLAC)
- Y-12 Atkins Nuclear Secured (Y-12 ANS)
- Y-12 National Security Complex (Y‑12)
- Y-12 Navarro Research and Engineering (Y-12 NRE)
All 27 active reporting organizations collected health data through the operation of their medical surveillance programs.
Twenty-five (25) organizations conducted exposure sampling through their industrial hygiene programs. DOE Oak Ridge Operations (DOE-ORO) and Golden SVCS, LLC (GSVCS) do not submit exposure sampling data since their workers are in the BAWR due to prior work at another DOE site and have no potential for exposure.
There are 8 reporting organizations that previously participated in the program, but due to contract changes or work completion, no longer submit data. The previously submitted data from these organizations, referred to as inactive reporting organizations, remain in the BAWR.
The inactive reporting organizations are:
- Advanced Mixed Waste Treatment Project (AMWTP)
- LLNL Boston University (LLNL BU)
- LLNL Envirocon, Inc. (LLNL ENVC)
- National Strategic Protective Services, LLC for ETTP and ORNL (NSPS)
- Rocky Flats Closure Project (RF)
- Southwestern Power Administration (SWPA)
- Wackenhut Security Services, Inc. for ETTP, ORNL, and Y-12 (WSI)
- Y-12 URS Corporation (Y-12 URS)
-
Geographical Locations for 27 Active BAWR Reporting Organizations (2019)
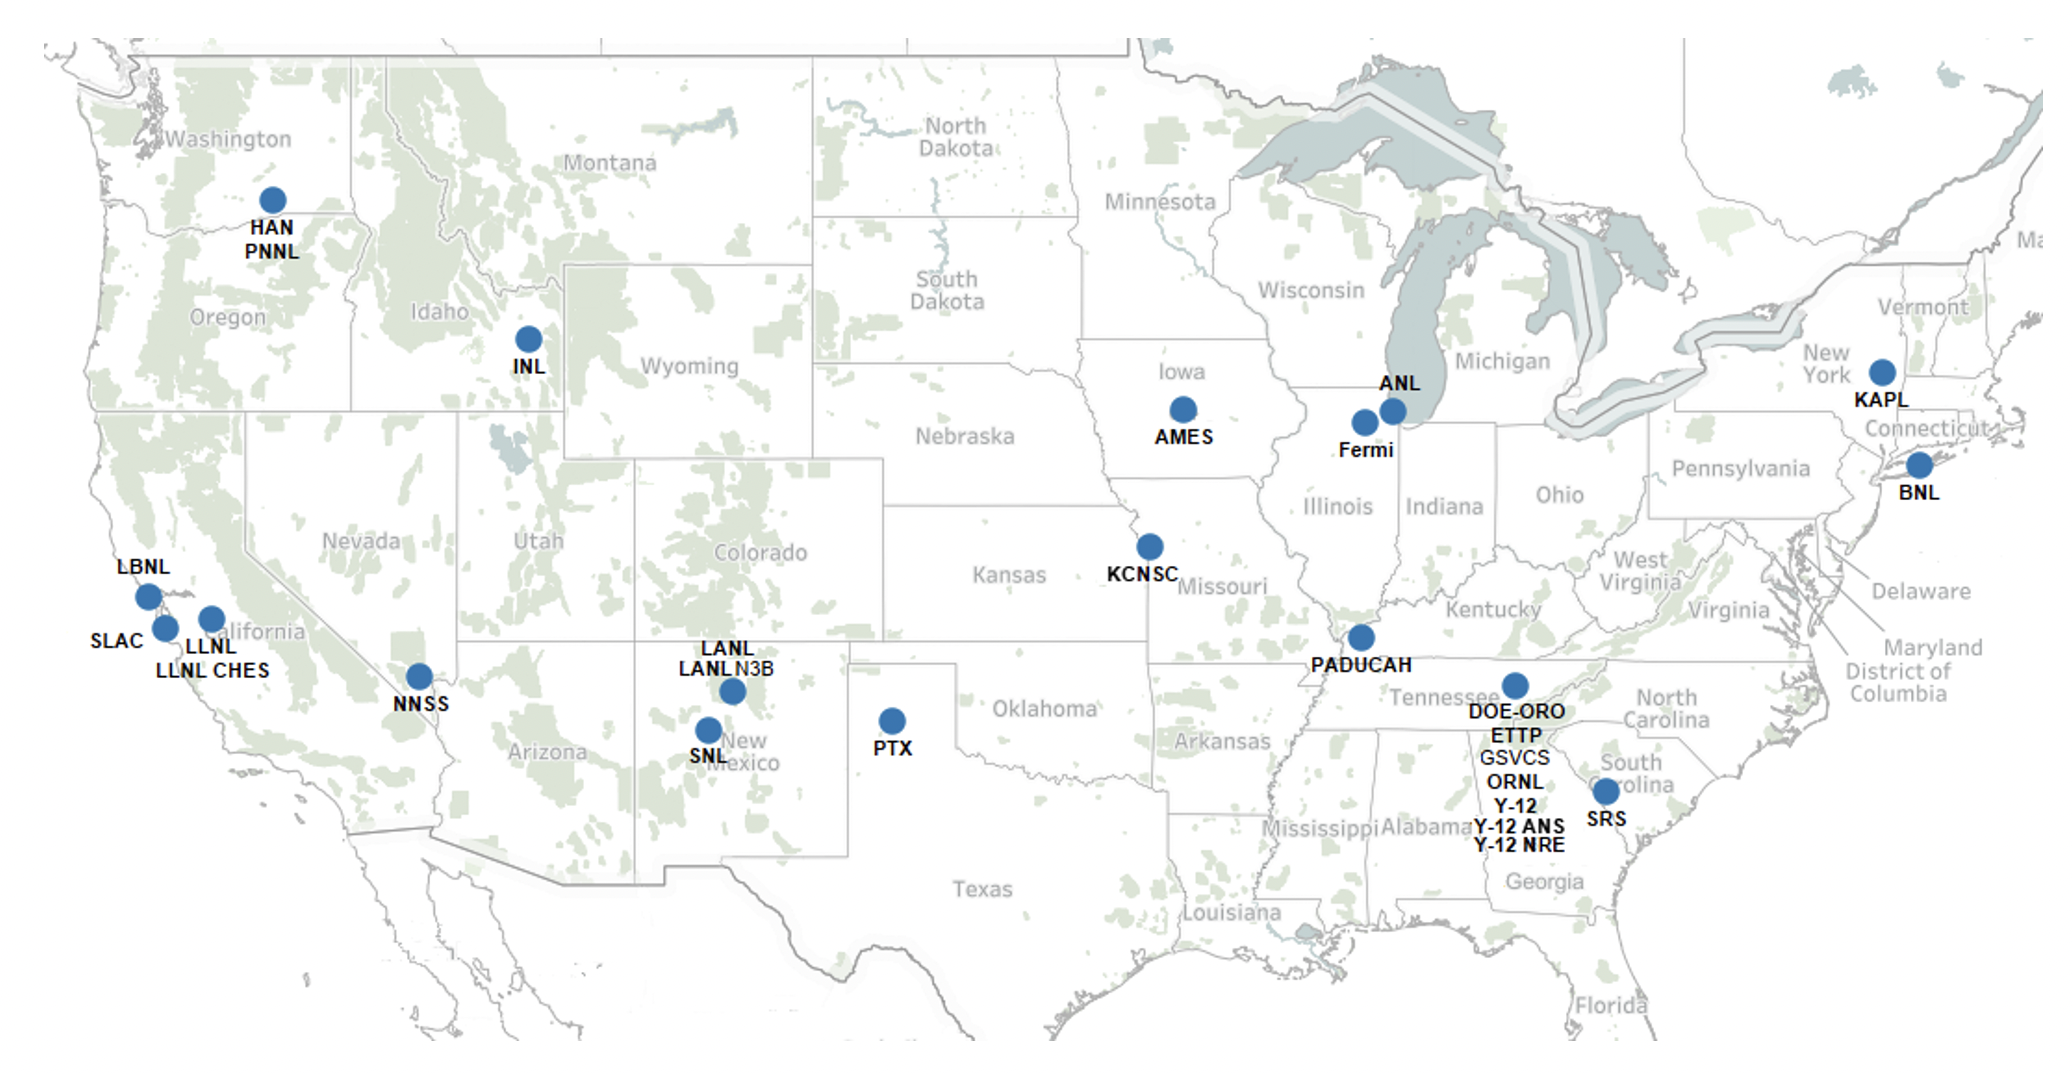
Select a location indicator (blue circle) to see additional information for the specific reporting organization.
This map shows the geographical locations of the 27 DOE-affiliated actively reporting organizations within the continental US.
Ames Laboratory (AMES)
Number of Employees: Roster BeLPT Tested Be Sensitized CBD Exposure Monitored 38 38 2 0 8 Argonne National Laboratory (ANL)
Number of Employees: Roster BeLPT Tested Be Sensitized CBD Exposure Monitored 376 171 3 0 23 Brookhaven National Laboratory (BNL)
Number of Employees: Roster BeLPT Tested Be Sensitized CBD Exposure Monitored 82 53 1 0 48 Fermi National Accelerator Laboratory (Fermi)
Number of Employees: Roster BeLPT Tested Be Sensitized CBD Exposure Monitored 29 21 0 0 23 Richland Area Reporting Locations
Hanford Site (HAN)
Number of Employees: Roster BeLPT Tested Be Sensitized CBD Exposure Monitored 15,670 9,554 117 34 1,938 Pacific Northwest National Laboratory (PNNL)
Number of Employees: Roster BeLPT Tested Be Sensitized CBD Exposure Monitored 401 368 8 0 49 Idaho National Laboratory (INL)
Number of Employees: Roster BeLPT Tested Be Sensitized CBD Exposure Monitored 1,200 425 3 0 355 Knolls Atomic Power Laboratory (KAPL)
Number of Employees: Roster BeLPT Tested Be Sensitized CBD Exposure Monitored 78 39 0 0 37 Los Alamos Area Reporting Locations
Los Alamos National Laboratory (LANL)
Number of Employees: Roster BeLPT Tested Be Sensitized CBD Exposure Monitored 4,493 3,147 28 3 785 LANL N3B Project (LANL N3B)
Number of Employees: Roster BeLPT Tested Be Sensitized CBD Exposure Monitored - - - - - Lawrence Berkeley National Laboratory (LBNL)
Number of Employees: Roster BeLPT Tested Be Sensitized CBD Exposure Monitored 37 26 2 0 8 Livermore Area Reporting Locations
Lawrence Livermore National Laboratory (LLNL)
Number of Employees: Roster BeLPT Tested Be Sensitized CBD Exposure Monitored 2,385 1,650 70 4 320 LLNL Clean Harbors Environmental Services (LLNL CHES)
Number of Employees: Roster BeLPT Tested Be Sensitized CBD Exposure Monitored 17 13 0 0 1 Kansas City National Security Campus (KCNSC)
Number of Employees: Roster BeLPT Tested Be Sensitized CBD Exposure Monitored 1,371 1,272 41 14 187 Nevada National Security Site (NNSS)
Number of Employees: Roster BeLPT Tested Be Sensitized CBD Exposure Monitored 1,317 1,174 23 5 283 Oak Ridge Area Reporting Locations
DOE Oak Ridge Office (DOE-ORO)
Number of Employees: Roster BeLPT Tested Be Sensitized CBD Exposure Monitored 94 94 1 0 NA Golden SVCS, LLC (GSVCS)
Number of Employees: Roster BeLPT Tested Be Sensitized CBD Exposure Monitored - - - - - East Tennessee Technology Park (ETTP)
Number of Employees: Roster BeLPT Tested Be Sensitized CBD Exposure Monitored 721 412 6 4 329 Oak Ridge National Laboratory (ORNL)
Number of Employees: Roster BeLPT Tested Be Sensitized CBD Exposure Monitored 947 855 18 0 279 Y-12 National Security Complex (Y-12)
Number of Employees: Roster BeLPT Tested Be Sensitized CBD Exposure Monitored 3,595 2,921 145 62 1,231 Y-12 Atkins Nuclear Secured (Y-12 ANS)
Number of Employees: Roster BeLPT Tested Be Sensitized CBD Exposure Monitored 30 30 0 0 22 Y-12 Navarro Research and Engineering (Y-12 NRE)
Number of Employees: Roster BeLPT Tested Be Sensitized CBD Exposure Monitored 19 19 0 0 15 Paducah Site (PADUCAH)
Number of Employees: Roster BeLPT Tested Be Sensitized CBD Exposure Monitored 291 211 5 0 76 Pantex Plant (PTX)
Number of Employees: Roster BeLPT Tested Be Sensitized CBD Exposure Monitored 2,038 1,933 27 15 537 Sandia National Laboratories (SNL)
Number of Employees: Roster BeLPT Tested Be Sensitized CBD Exposure Monitored 647 643 1 0 138 Savannah River Site (SRS)
Number of Employees: Roster BeLPT Tested Be Sensitized CBD Exposure Monitored 1,822 820 20 6 199 SLAC National Accelerator Laboratory (SLAC)
Number of Employees: Roster BeLPT Tested Be Sensitized CBD Exposure Monitored 87 49 0 1 26 -
Data Coordinator Changes by Reporting Organization (2013-2019)
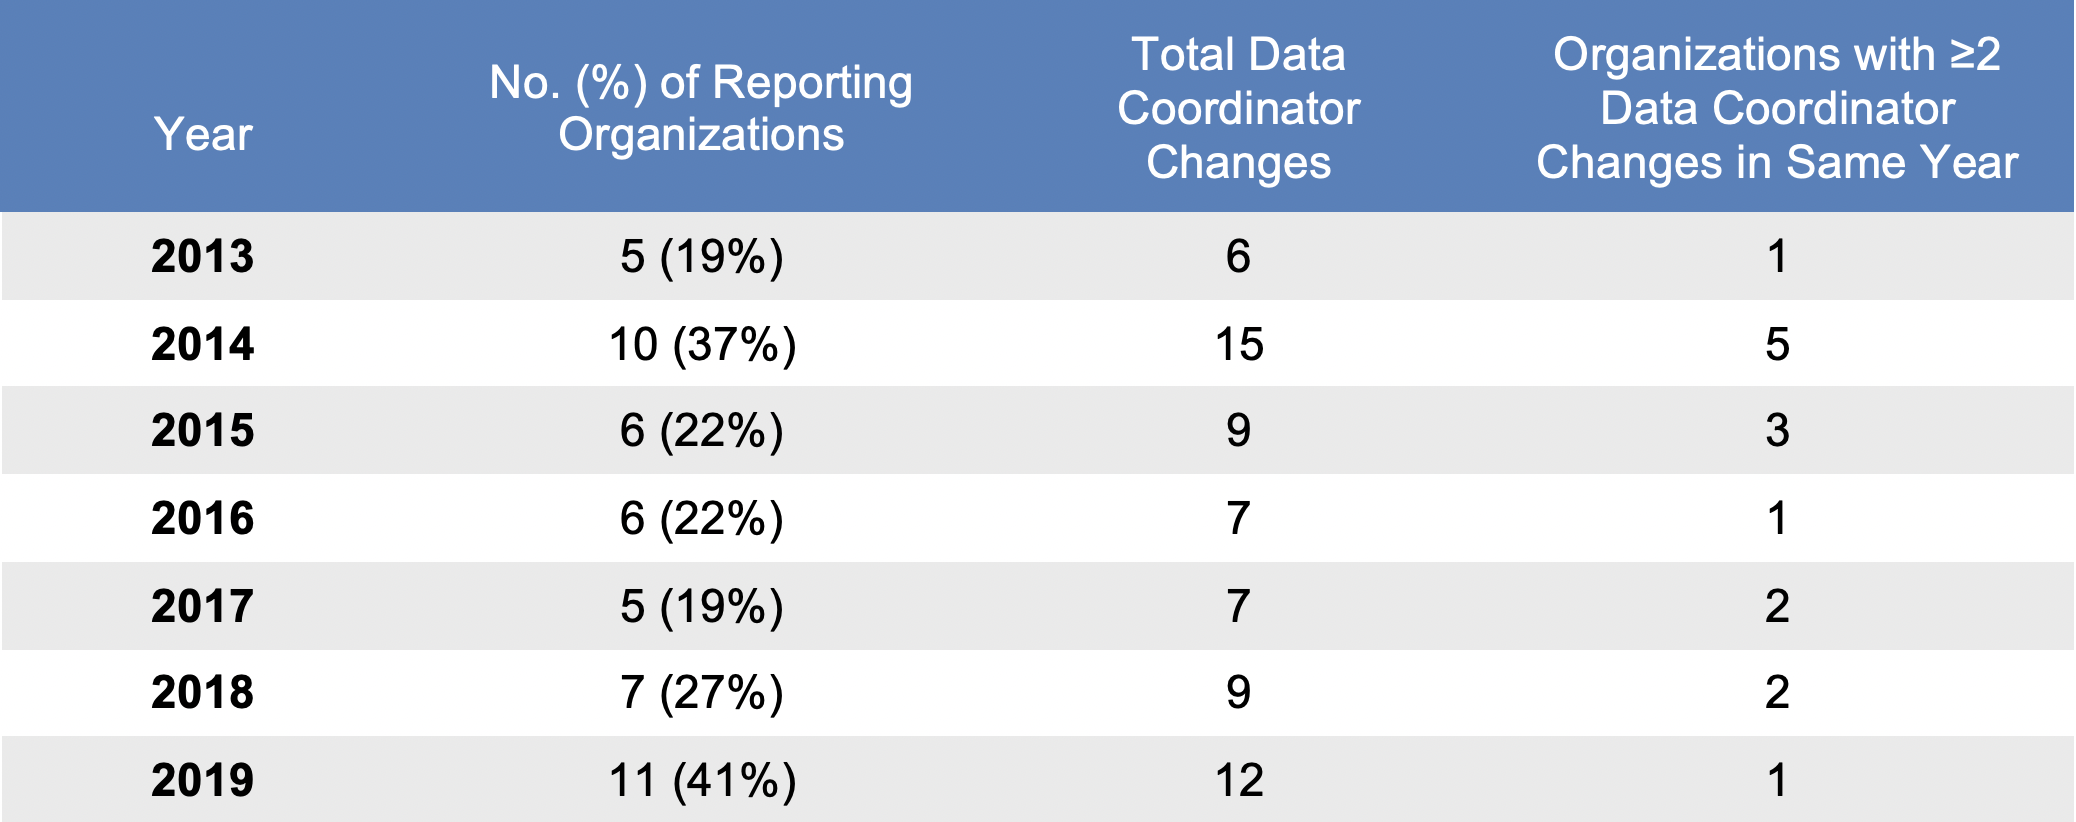
Each reporting organization designates a data coordinator who is responsible for coordinating activities at the site related to data collection, timely submittal of data, and responding to inquiries from the DOE Program Manager and ORISE Data Center as outlined in the DOE technical standard, DOE-STD-1187-2019. The following table shows that there were 12 data coordinator changes in 2018, which was higher than in any of the previous 5 years.
Year No. (%) of Reporting Organizations Total Data Coordinator Changes Organizations with ≥2 Data Coordinator Changes in Same Year 2013 5 (19%) 6 1 2014 10 (37%) 15 5 2015 6 (22%) 9 3 2016 6 (22%) 7 1 2017 5 (19%) 7 2 2018 7 (27%) 9 2 2019 11 (41%) 12 1 Changes in data coordinators often result in the need for additional training and subsequent delays in data submissions. Therefore, significant data coordinator turnover can impact the timely acquisition of data and subsequent reporting of results.
-
Workers reported to the BAWR by Reporting Organization (2002-2019)*
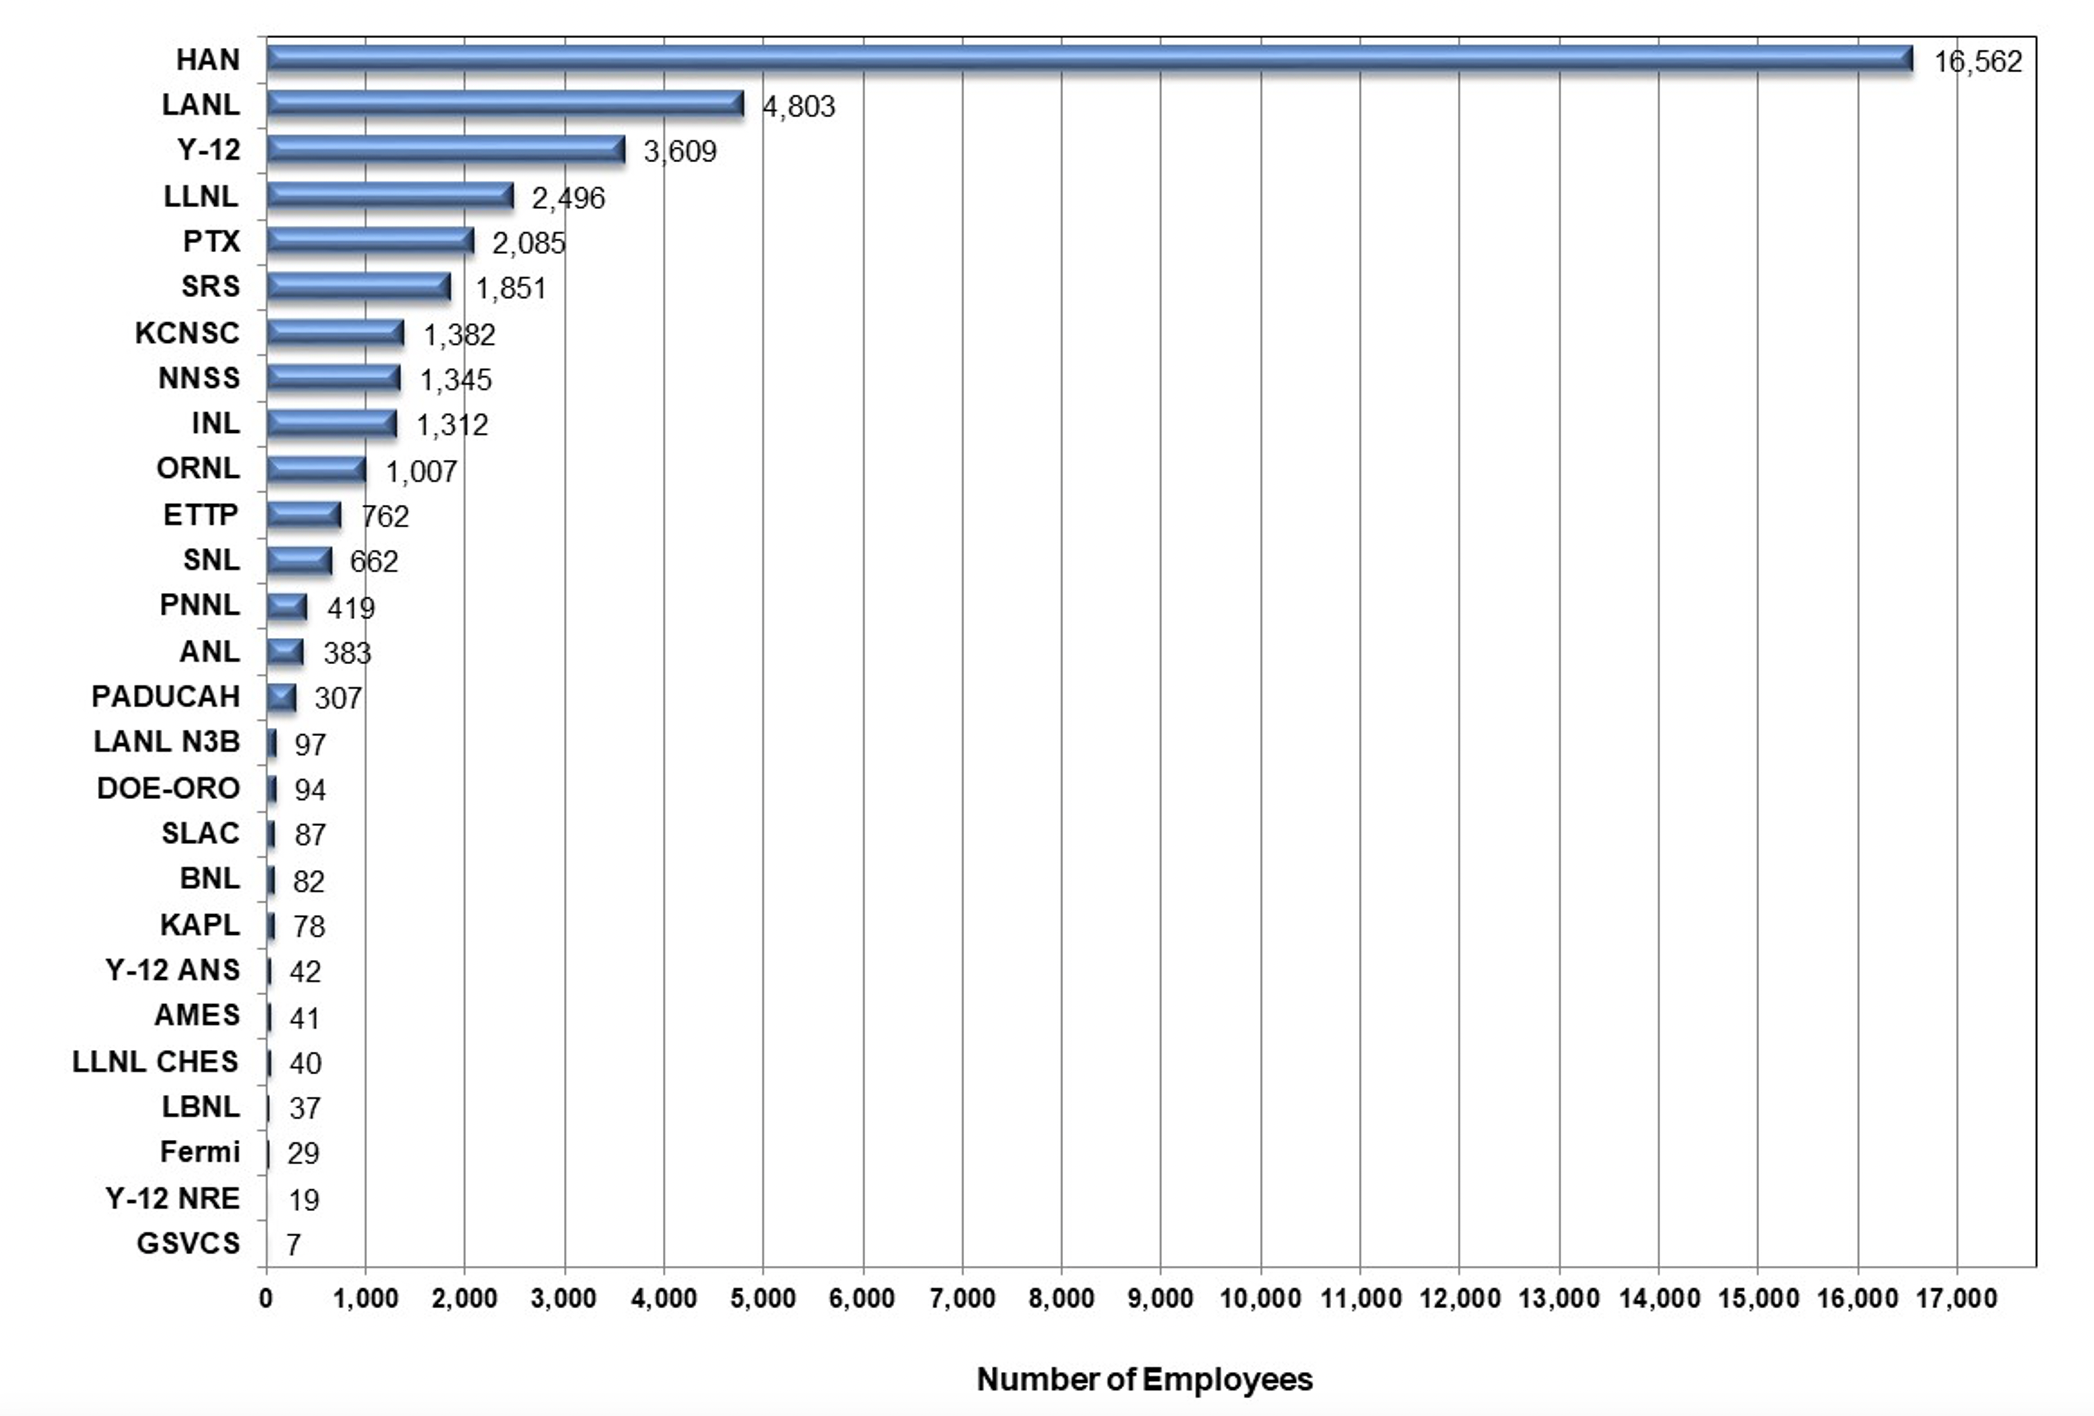
This figure shows the cumulative numbers of beryllium-associated workers reported to the BAWR by reporting organization. Through CY2019, there were 39,638 workers in the cumulative roster as compared to 37,805 workers in the cumulative roster through CY2018, for an increase of 1,853 workers. Hanford site has 16,562 employees in the roster, constituting the largest number (42%) in the cumulative roster.
*Some reporting organizations have provided data that predate the 2002 start date of the Registry.
-
Gender and Age Distribution for Workers (2002-2019)*
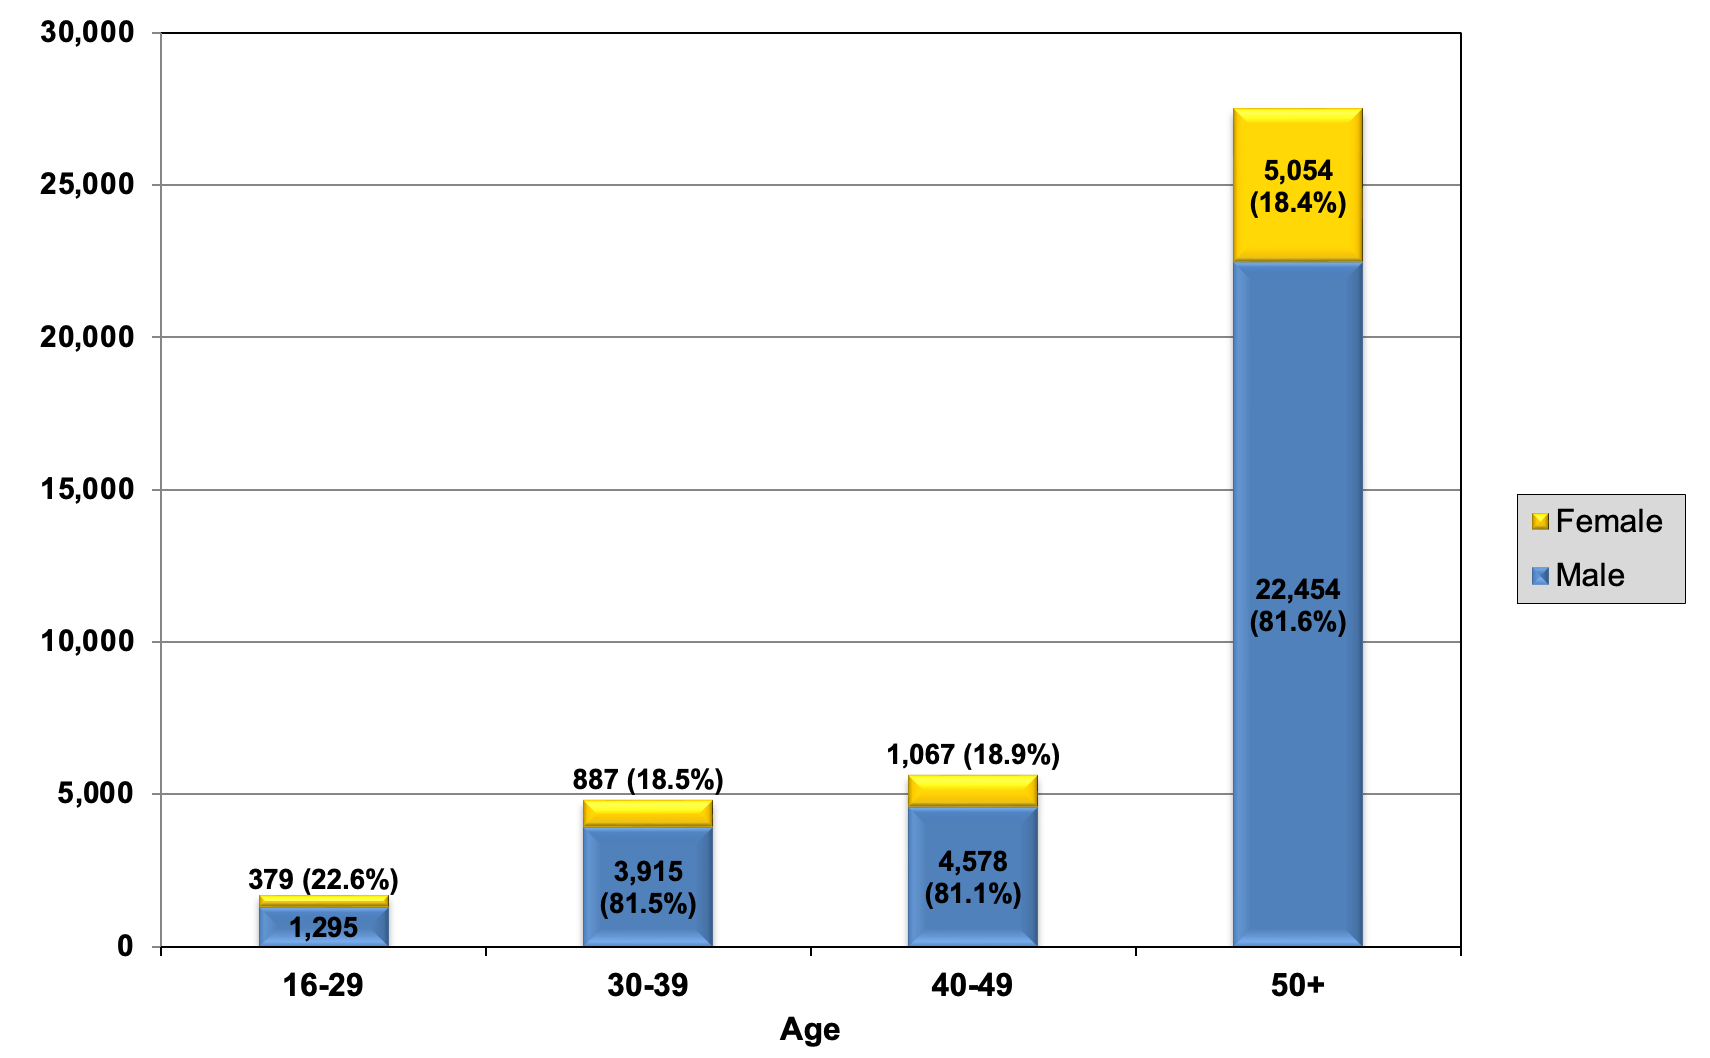
Workers are predominantly male (approximately 88.4%) and greater than 50 years old (66.7%). This chart excludes 8 workers for whom demographic data were not available.
*Some reporting organizations have provided data that predate the 2002 start date of the Registry.
Health Monitoring Results
Sites’ health clinics collect medical surveillance data on employees identified by their beryllium rosters. These data sets contain beryllium-related health monitoring information and the results of any specialized medical testing. The Site Occupational Medical Director (SOMD) determines the content and frequency of surveillance evaluations and tests based on policies, standards, and the employee’s health and work history. The most vital information collected and reported on an annual basis are the number of employees monitored for beryllium sensitization using the BeLPT, the number of new BeS cases identified, and the number of new cases of CBD.
Some employees in the roster may decline testing for sensitizations. As a result, no records will be available for individuals who refuse this diagnostic evaluation. Some employees may have testing done independently (for example, as part of a former worker program), and in these cases results may be unavailable for Registry reporting unless the employee releases their evaluation report, and it becomes part of the organization’s electronic medical records. Also, advanced medical testing results when employees are referred (after findings suggestive of possible CBD) to a pulmonary medicine or other specialized clinic for follow-up diagnosis and care may not be reported and/or can be difficult to collect.
Sensitization and CBD Screening
The cumulative number of workers with BeLPT screening results submitted to the BAWR through CY2019 was 27,204. When compared with the 25,957 workers screened through CY2018, this corresponds to an additional 1,247 employees tested for an increase of 5%.
There was a total of 532 sensitized workers included in the BAWR, and medical staff diagnosed 155 as having CBD through CY2019. BeS and CBD are mutually exclusive categories, i.e., if a person who is BeS receives a CBD diagnosis, the person’s diagnosis moves to the CBD category and is no longer counted in the BeS category.
-
Number and Proportion of Workers undergoing BeLPT Testing and Diagnosed with BeS or Diagnosed with CBD by Reporting Organization (n=27,204) (2002-2019)*
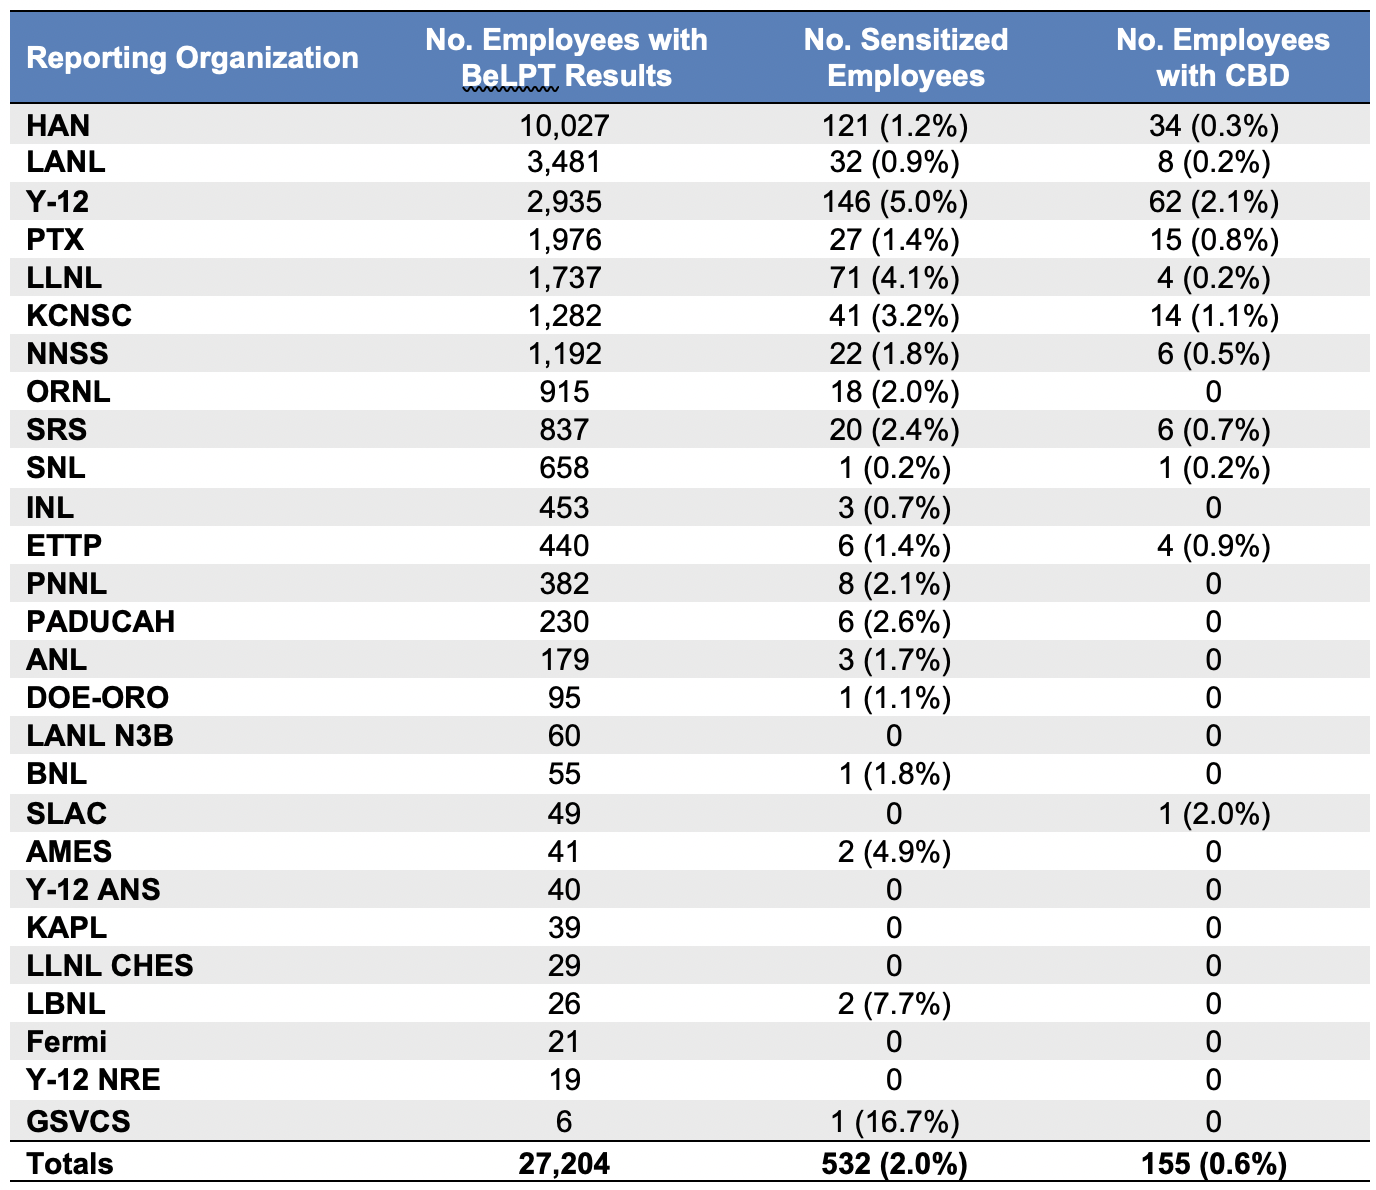
Reporting Organization No. Employees with BeLPT Results No. Sensitized Employees No. Employees with CBD HAN 10,027 121 (1.2%) 34 (0.3%) LANL 3,481 32 (0.9%) 8 (0.2%) Y12 2,935 146 (5.0%) 62 (2.1%) PTX 1,976 27 (1.4%) 15 (0.8%) LLNL 1,737 71 (4.1%) 4 (0.2%) KCNSC 1,282 41 (3.2%) 14 (1.1%) NNSS 1,192 22 (1.8%) 6 (0.5%) ORNL 915 18 (2.0%) 0 (0.0%) SRS 837 20 (2.4%) 6 (0.7%) SNL 658 1 (0.2%) 1 (0.2%) INL 453 3 (0.7%) 0 (0.0%) ETTP 440 6 (1.4%) 4 (0.9%) PNNL 382 8 (2.1%) 0 (0.0%) PADUCAH 230 6 (2.6%) 0 (0.0%) ANL 179 3 (1.7%) 0 (0.0%) DOE-ORO 95 1 (1.1%) 0 (0.0%) LANL N3B 60 0 (0.0%) 0 (0.0%) BNL 55 1 (1.8%) 0 (0.0%) SLAC 49 0 (0.0%) 1 (2.0%) AMES 41 2 (4.9%) 0 (0.0%) Y-12 ANS 40 0 (0.0%) 0 (0.0%) KAPL 39 0 (0.0%) 0 (0.0%) LLNL CHES 29 0 (0.0%) 0 (0.0%) LBNL 26 2 (7.7%) 0 (0.0%) Fermi 21 0 (0.0%) 0 (0.0%) Y-12 NRE 19 0 (0.0%) 0 (0.0%) GSVCS 6 1 (16.7%) 0 (0.0%) Totals 27,204 532 (2.0%) 155 (0.6%) The total number of beryllium-sensitized employees increased by 17 through CY2019 (523 total BeS cases reported through CY2018). The newly reported BeS cases were from 6 reporting organizations (1 at GSVCS, 4 at HAN, 9 at LANL, 1 at LLNL, 1 at PADUCAH, and 1 at Y-12). Ten (10) employees had reported dates of sensitization in 2019. The remaining seven (7) cases (from GSVCS, LANL, and PADUCAH) had dates of sensitization ranging from 2009 through 2018. Seven (7) prior BeS cases from LANL (5), NNSS (1), and SNL (1) progressed to CBD in CY2019, hence, the total CBD cases increased by 7.
Twenty (20) of the reporting organizations have beryllium-sensitized employees and 11 have employees who have been diagnosed with CBD.
*Some reporting organizations have provided data that predate the 2002 start date of the registry.
-
Number and Percent Proportion of Workers Undergoing BeLPT Testing, and Yielding Abnormal BeS or CBD Results (n=39,638) (2002-2019)*
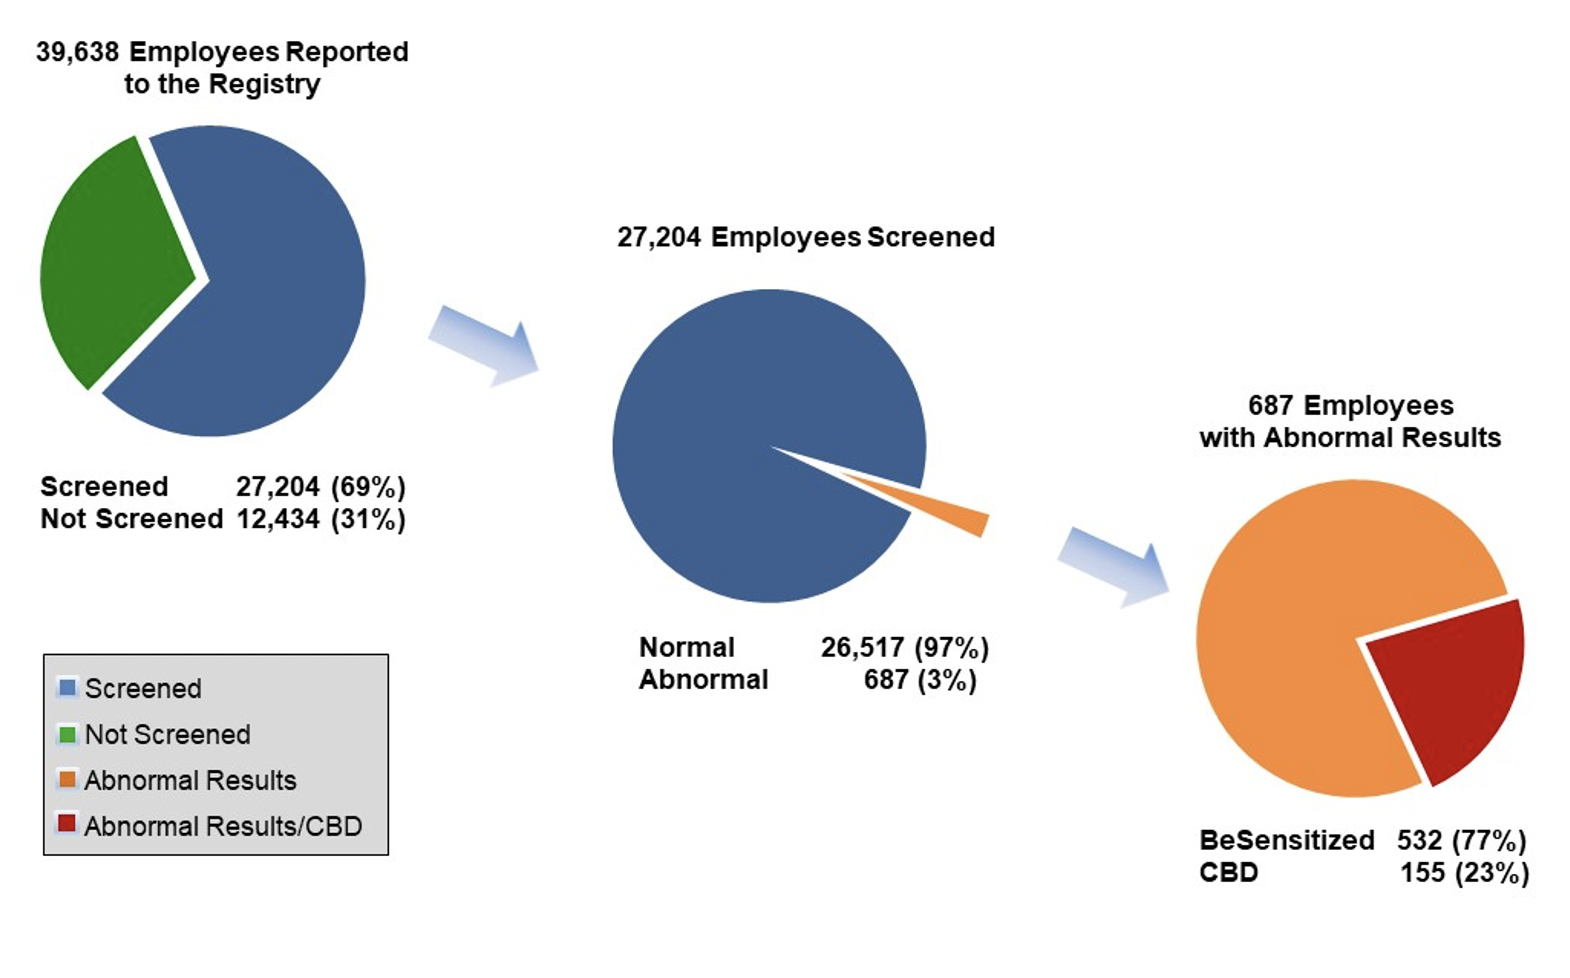
This figure depicts the numbers and percentages across the DOE complex of employees screened using the BeLPT test and among those employees having abnormal results, how many are sensitized or have developed CBD. Comparison with previous years’ reports show that these DOE-wide percentage distributions have remained consistent.
*Some reporting organizations have provided data that predate the 2002 start date of the registry.
-
Percent Proportion of Workers Diagnosed as BeS by Reporting Organization (n=532) (2002-2019)*
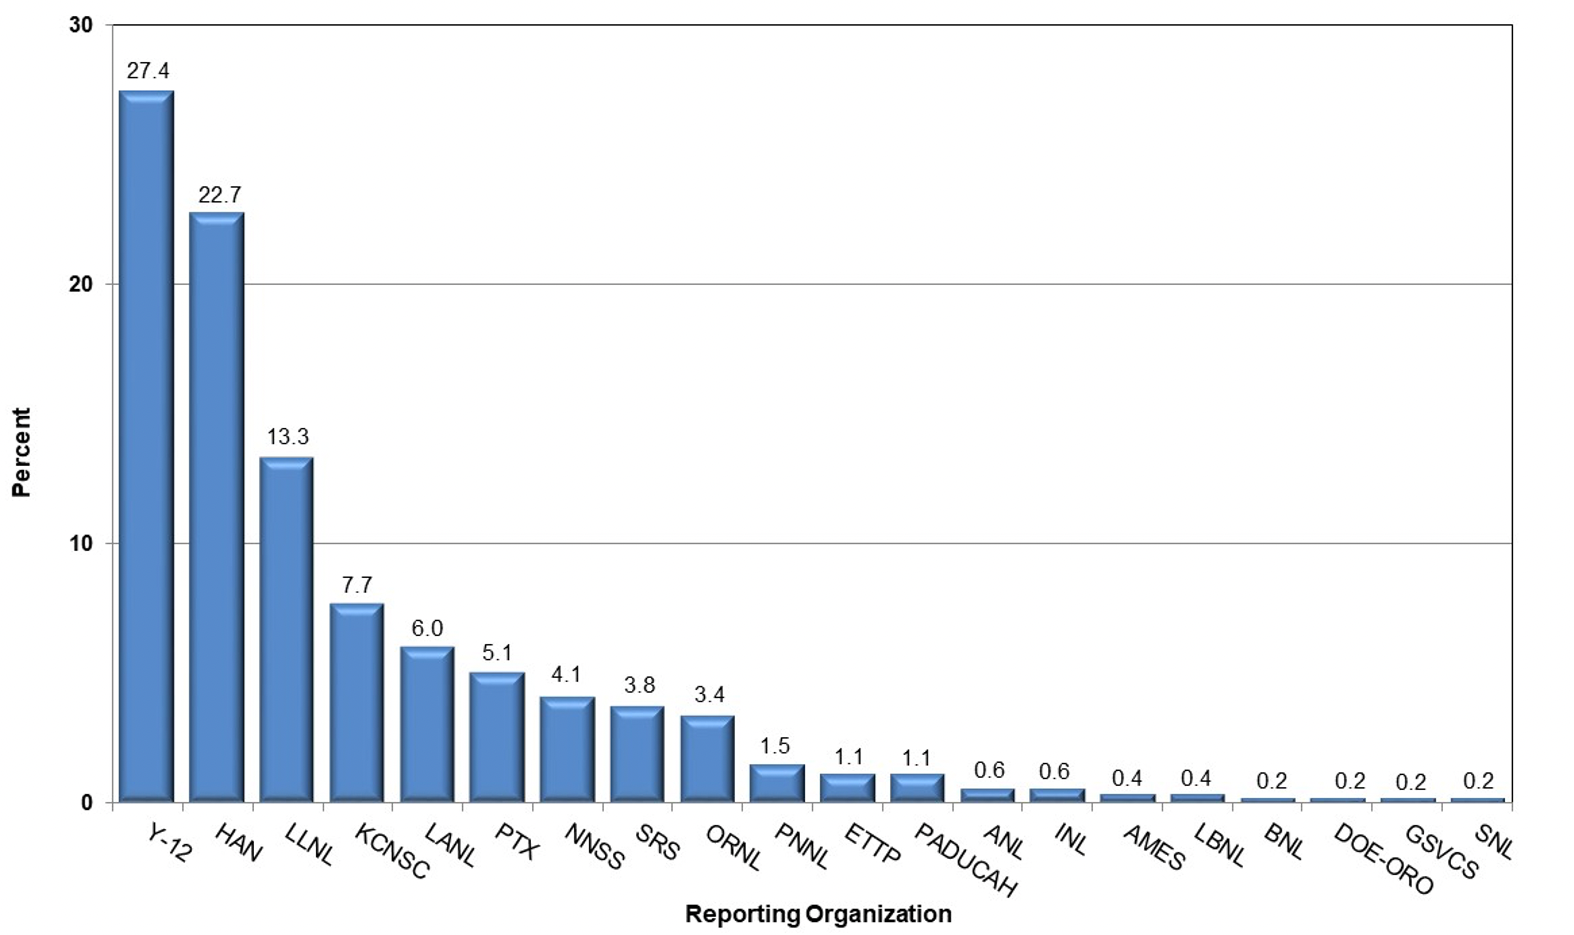
This figure presents the distribution in percent of BeS cases by reporting organization. Of the 20 reporting organizations, about 50% of total BeS cases are associated with the Y-12 and HAN sites.
*Some reporting organizations have provided data that predate the 2002 start date of the registry.
-
Percent Proportion of Workers Diagnosed as CBD by Reporting Organization (n=155) (2002-2019)*
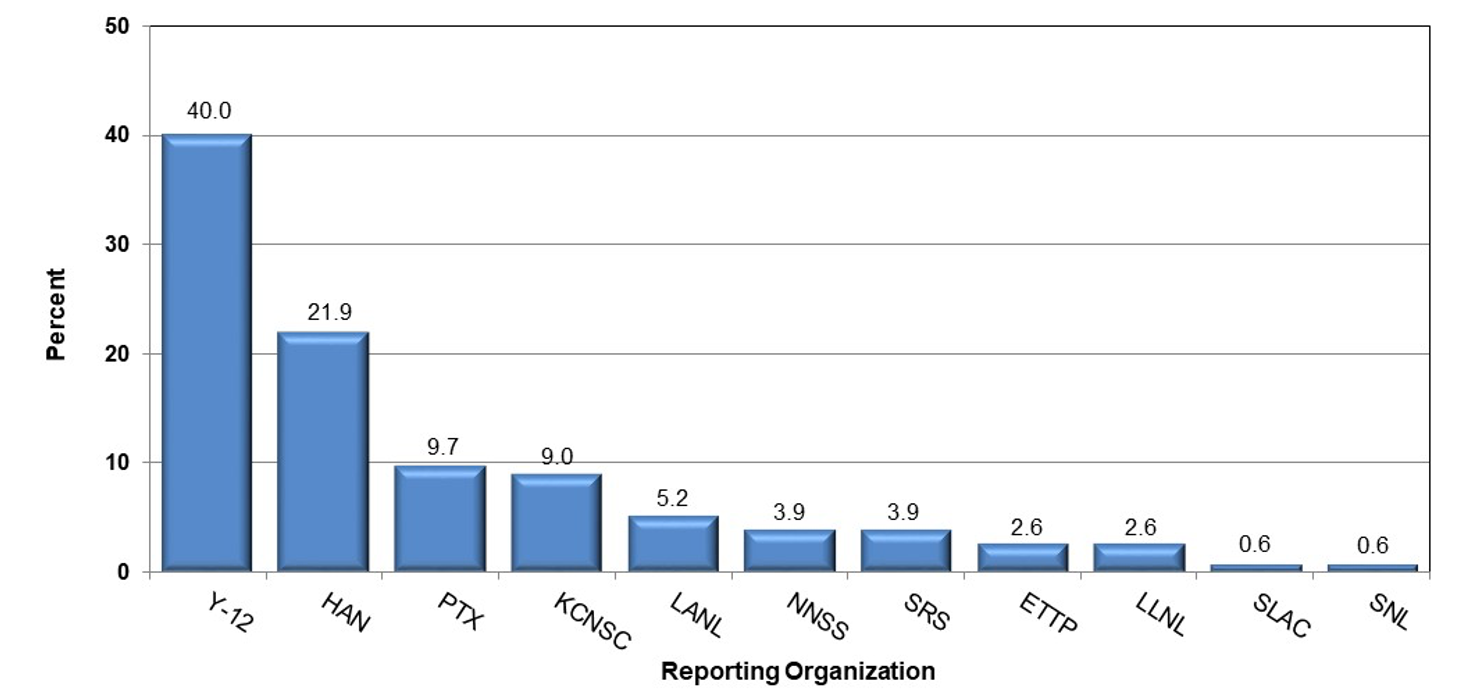
This figure presents the distribution in percent for the 11 reporting organizations with employees diagnosed with CBD. Approximately 60% of total CBD cases are associated with the Y-12 and HAN sites.
*Some reporting organizations have provided data that predate the 2002 start date of the registry.
-
Number and Percent of Workers Categorized by Number of Years Following Hire Date, Undergoing BeLPT and Diagnosed with BeS or Diagnosed with CDB (n=39,638) (2002-2019)*
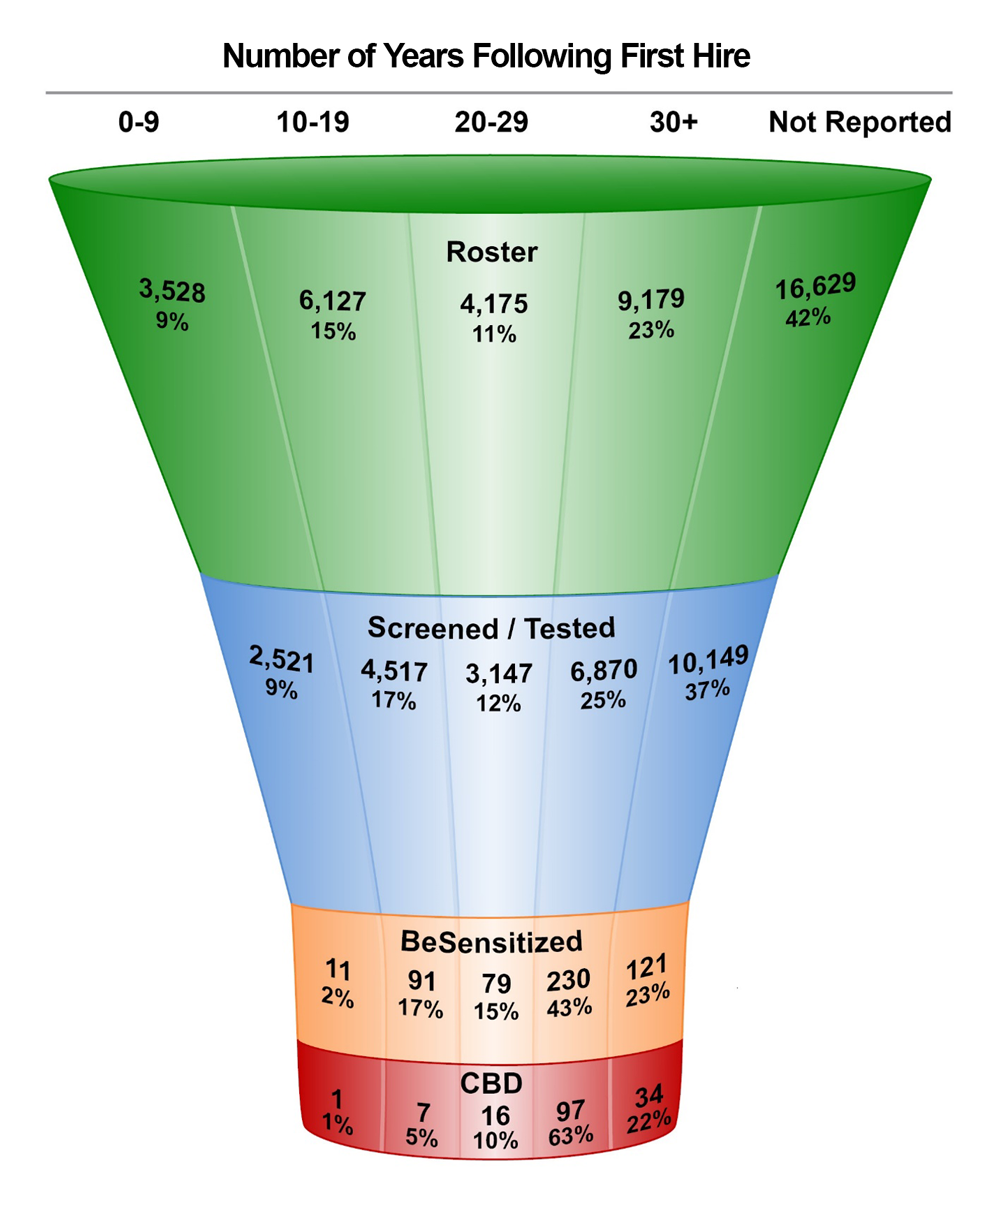
This figure shows the number of beryllium-associated workers categorized by years following first hire, including roster total, those screened, and those with beryllium sensitization or CBD.
*Some reporting organizations have provided data that predate the 2002 start date of the registry.
-
Number of Workers Undergoing BeLPT and Diagnosed with BeS or Diagnosed with CDB (n=39,638) (2002-2019)*
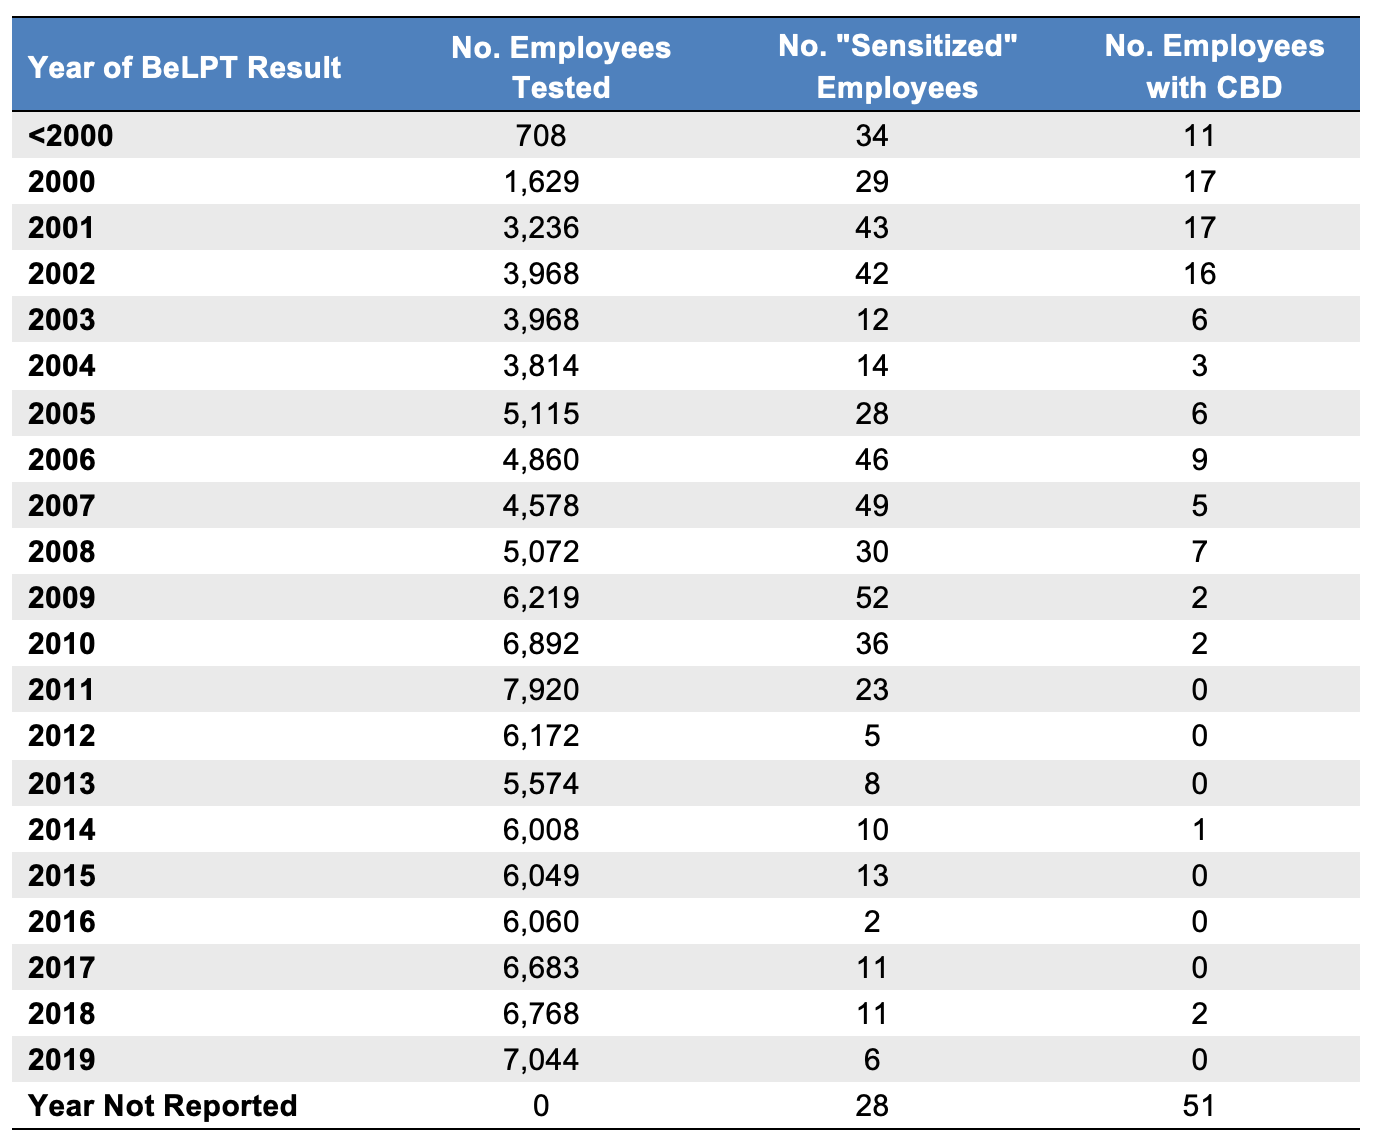
This table provides the numbers of beryllium-associated workers with BeLPT test results submitted to the BAWR each year, and the year of first positive or abnormal BeLPT result for those who were beryllium-sensitized or diagnosed as having CBD. First positive or abnormal BeLPT result is an important medical surveillance sentinel, resulting in earlier or more frequent repeat testing, hence, earlier diagnosis, earlier work restrictions, and more successful treatment. It is also a criterion for eligibility for compensation and payment of medical expenses under the Energy Employees Occupational Illness Compensation Program Act (EEOICPA). Two (2) abnormal BeLPT results or 1 abnormal and 2 borderline BeLPT results are required to categorize an employee as BeS. Since a worker may choose not to have repeat BeLPT measurements, may change work and have long lags between measurements, or may not test abnormal for a period of time, the year of first BeLPT provides a more reliable metric than the year a worker becomes BeS.
Year of BeLPT Result No. Employees Tested No. Sensitized Employees No. Employees with CBD <2000 708 34 11 2000 1,629 29 17 2001 3,236 43 17 2002 3,968 42 16 2003 3,968 12 6 2004 3,814 14 3 2005 5,115 28 6 2006 4,860 46 9 2007 4,578 49 5 2008 5,072 30 7 2009 6,219 52 2 2010 6,892 36 2 2011 7,920 23 0 2012 6,172 5 0 2013 5,574 8 0 2014 6,008 10 1 2015 6,049 13 0 2016 6,060 2 0 2017 6,683 11 0 2018 6,768 11 2 2019 7,044 6 0 Year Not Reported 0 28 51 *The number of "Employees Tested" includes all testing with results of Normal, Negative, Borderline, Positive, Abnormal, and Unsatisfactory. Employees tested periodically are included in each year they were tested. Data capture includes prior to the year 2002.
-
Number and Percent Proportion of Workers with Abnormal BeLPT Results BeS or CBD Results (n=27,204) (2002-2019)*
The yearly average for workers developing sensitization, whose first abnormal lymphocyte proliferation test results were between 2000 and 2009, was 34. This rate dropped to an average of 13 from 2010 to 2019. For workers later diagnosed with CBD, the yearly averages dropped from 9 to less than 1 per year for the respective time frames. These results provide evidence that programs are serving to improve worker protection and reduce the risk of CBD.
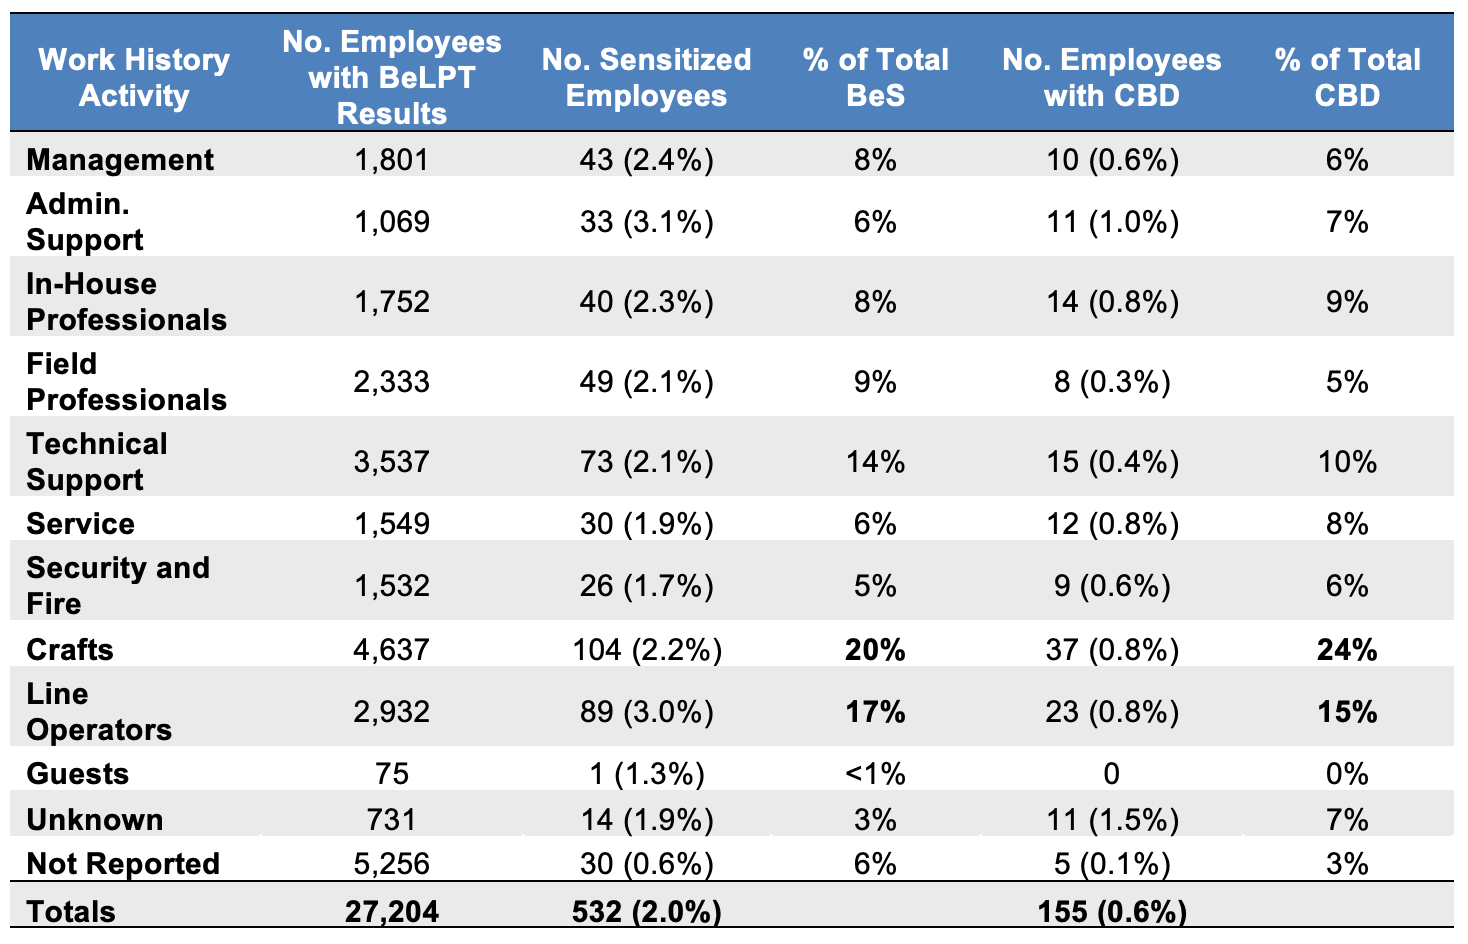
This table lists beryllium-sensitized, or CBD diagnosed workers, through 2019 grouped by their work history activity, which is a high-level rollup of job function. Based on the data submitted through 2019 and as presented in the table, the majority of both reported beryllium sensitizations (36.9 %) and CBD cases (39.9%) occurred among the broad occupational groups of Crafts and Line Operators.
Work History Activity Employees with BeLPT Results (N=27,204) No. Sensitized Employees (n=532) Beryllium Sensitization (%) (n=532)
No. Employees with CBD (n=155) Chronic Beryllium Disease (%) (n=155) Management 1,801 43 (2.4%) 8% 10 (0.6%) 6% Admin. Support 1,069 33 (3.1%) 6% 11 (1.0%) 7% In-House Professionals 1,752 40 (2.3%) 8% 14 (0.8%) 9% Field Professionals 2,333 49 (2.1%) 9% 8 (0.3%) 5% Technical Support 3,537 73 (2.1%) 14% 15 (0.4%) 10% Service 1,549 30 (1.9%) 6% 12 (0.8%) 8% Security and Fire 1,532 26 (1.7%) 5% 9 (0.6%) 6% Crafts 4,637 104 (2.2%) 20% 37 (0.8%) 24% Line Operators 2,932 89 (3.0%) 17% 23 (0.8%) 15% Guests 75 1 (1.3%) <1% 0 (0.0%) 0% Unknown 731 14 (1.9%) 3% 11 (1.5%) 7% Not Reported 5,256 30 (0.6%) 6% 5 (0.1%) 3% Totals 27,204 532 (2.0%) 100% 155 (0.6%) 100% *Some reporting organizations have provided data that predate the 2002 start date of the Registry.
-
Comparison of the Number and Percent Proportion of Workers Undergoing BeLPT to the Number of Employees with BeLPT Results by Reporting Organization (n=8,194) (2002-2019)*.
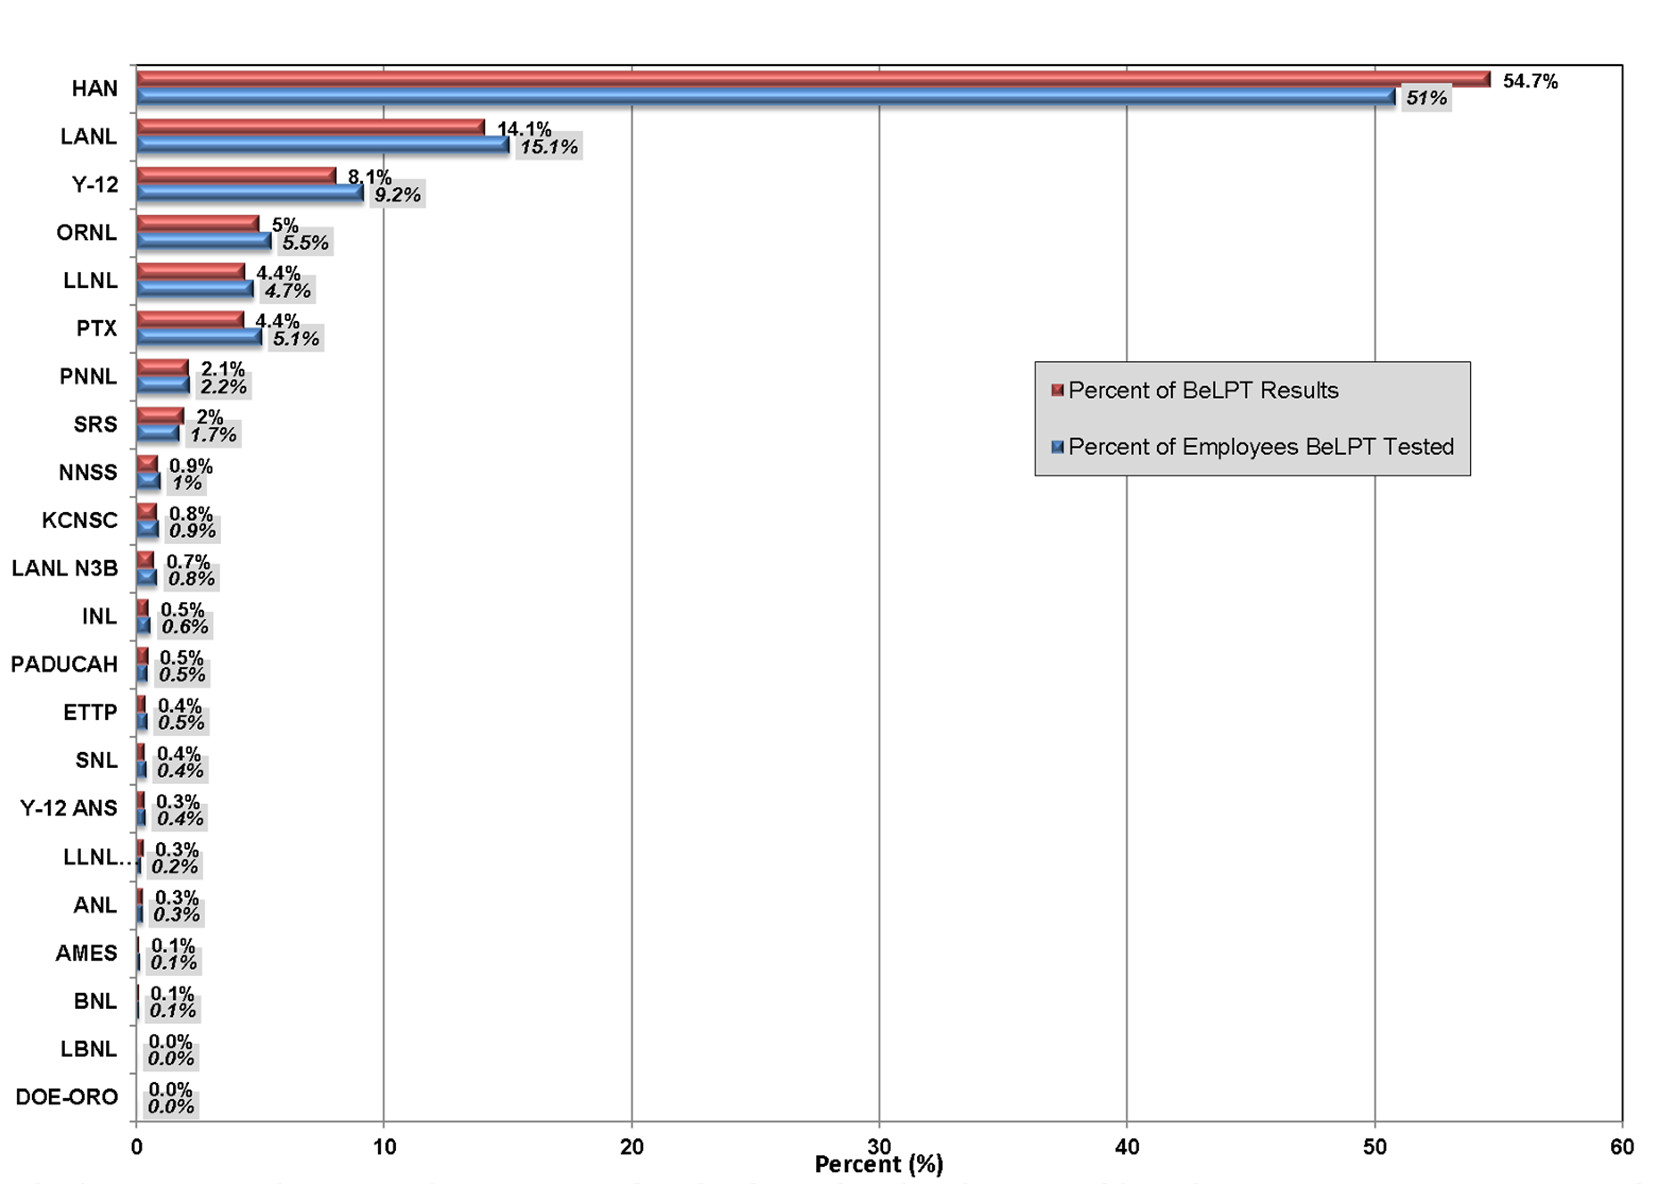
This figure compares the percent of BeLPT tests conducted to the number of employees tested for each reporting organization in 2018. Employees may be BeLPT tested multiple times in a year if they have abnormal or borderline results. Therefore, the number of BeLPT tests conducted are higher than the number of employees tested.
*Some reporting organizations have provided data that predate the 2002 start date of the Registry.
Exposure Monitoring Results
The BAWR receives beryllium work history and exposure data. The submission contains information about all activities with the potential for beryllium exposure including where the beryllium-associated worker currently works or previously worked, and the exposures associated with those activities. Reporting organization staff collect retrospective work history information through questionnaires and interviews with the worker or from records if accessible. This information includes location, organization, and job title for employees who work directly with beryllium, work in areas of potential beryllium exposure even if not working directly with beryllium, and activities with potential casual exposure to beryllium, such as working near an area where others are working directly with beryllium.
Exposure Monitoring Trends - Employees
The cumulative number of employees monitored through CY2019 was 7,239 compared to 6,917 employees monitored through CY2018 as reported in the Beryllium-Associated Worker Registry 2018 Dashboard. This equates to an increase of 322 employees monitored for exposure to beryllium through CY2019. The increase in the CY2019 report is higher than the reported increase of 256 between CY2017 and CY2018 and higher than the increase of 220 employees between the CY2016 and CY2017 reports.
Seventeen (17) reporting organizations provided exposure monitoring results with monitoring dates in 2019. Organization-specific totals for a given year may change from totals in previous annual reports due to late reporting and/or corrections.
-
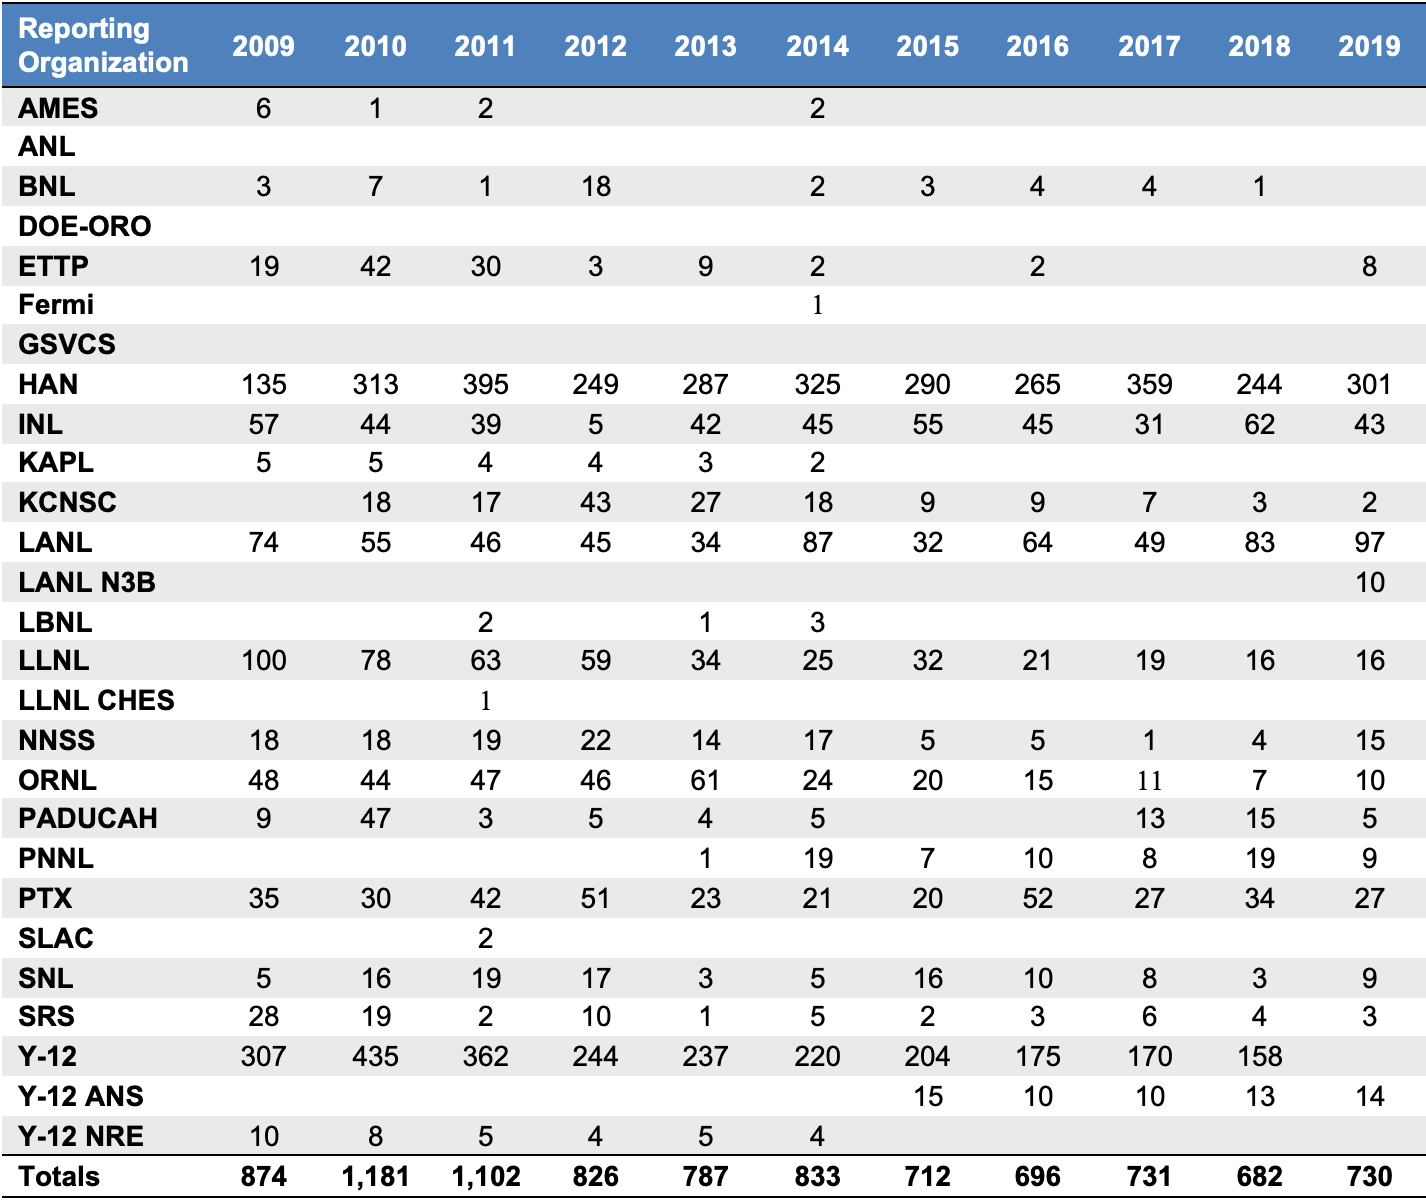
Number and Percent of Workers Monitored by Reporting Organization (n=4,112) (2010-2019)
Reporting Organization 2010
n=1,1812011
n=1,1022012
n=8262013
n=7872014
n=8332015
n=7122016
n=6962017
n=7312018
n=6822019
n=730AMES 1 (0.1%) 2 (0.2%) 2 (0.2%) 5 (0.7%) ANL BNL 7 (0.6%) 1 (0.1%) 18 (2.2%) 2 (0.2%) 3 (0.4%) 4 (0.6%) 4 (0.5%) 1 (0.1%) DOE-ORO ETTP 42 (3.6%) 30 (2.7%) 3 (0.4%) 9 (1.1%) 2 (0.2%) 2 (0.3%) 8 (1.1%) Fermi 1 (0.1%) GSVCS HAN 313 (26.5%) 395 (35.8%) 249 (30.1%) 287 (36.5%) 325 (39%) 290 (40.7%) 265 (38.1%) 359 (49.1%) 244 (35.8%) 301 (41.2%) INL 44 (3.7%) 39 (3.5%) 5 (0.6%) 42 (5.3%) 45 (5.4%) 55 (7.7%) 45 (6.5%) 31 (4.2%) 62 (9.1%) 43 (5.9%) KAPL 5 (0.4%) 4 (0.4%) 4 (0.5%) 3 (0.4%) 2 (0.2%) KCNSC 18 (1.5%) 17 (1.5%) 43 (5.2%) 27 (3.4%) 18 (2.2%) 9 (1.3%) 9 (1.3%) 7 (1%) 3 (0.4%) 2 (0.3%) LANL 55 (4.7%) 46 (4.2%) 45 (5.4%) 34 (4.3%) 87 (10.4%) 32 (4.5%) 64 (9.2%) 49 (6.7%) 83 (12.2%) 97 (13.3%) LANL N3B 10 (1.4%) LBNL 2 (0.2%) 1 (0.1%) 3 (0.4%) LLNL 78 (6.6%) 63 (5.7%) 59 (7.1%) 34 (4.3%) 25 (3%) 32 (4.5%) 21 (3%) 19 (2.6%) 16 (2.3%) 16 (2.2%) LLNL CHES 1 (0.1%) NNSS 18 (1.5%) 19 (1.7%) 22 (2.7%) 14 (1.8%) 17 (2%) 5 (0.7%) 5 (0.7%) 1 (0.1%) 4 (0.6%) 15 (2.1%) ORNL 44 (3.7%) 47 (4.3%) 46 (5.6%) 61 (7.8%) 24 (2.9%) 20 (2.8%) 15 (2.2%) 11 (1.5%) 7 (1%) 10 (1.4%) PADUCAH 47 (4%) 3 (0.3%) 5 (0.6%) 4 (0.5%) 5 (0.6%) 13 (1.8%) 15 (2.2%) 5 (0.7%) PNNL 1 (0.1%) 19 (2.3%) 7 (1%) 10 (1.4%) 8 (1.1%) 19 (2.8%) 9 (1.2%) PTX 30 (2.5%) 42 (3.8%) 51 (6.2%) 23 (2.9%) 21 (2.5%) 20 (2.8%) 52 (7.5%) 27 (3.7%) 34 (5%) 27 (3.7%) SLAC 2 (0.2%) SNL 16 (1.4%) 19 (1.7%) 17 (2.1%) 3 (0.4%) 5 (0.6%) 16 (2.2%) 10 (1.4%) 8 (1.1%) 3 (0.4%) 9 (1.2%) SRS 19 (1.6%) 2 (0.2%) 10 (1.2%) 1 (0.1%) 5 (0.6%) 2 (0.3%) 3 (0.4%) 6 (0.8%) 4 (0.6%) 3 (0.4%) Y-12 436 (36.9%) 363 (32.9%) 245 (29.7%) 238 (30.2%) 221 (26.5%) 206 (28.9%) 181 (26%) 178 (24.4%) 174 (25.5%) 156 (21.4%) Y-12 ANS 15 (2.1%) 10 (1.4%) 10 (1.4%) 13 (1.9%) 14 (1.9%) Y-12 NRE 8 (0.7%) 5 (0.5%) 4 (0.5%) 5 (0.6%) 4 (0.5%) Totals 1,181 (100%) 1,102 (100%) 826 (100%) 787 (100%) 833 (100%) 712 (100%) 696 (100%) 731 (100%) 682 (100%) 730 (100%) An industrial hygienist monitored exposure for employees by reporting organization at least once in each year for the past 10 years (i.e., between 2010 and 2019).
-
Number and Percent Proportion of Workers Undergoing Beryllium Exposure Monitoring by Reporting organization (n=7,239) (2002-2019)*
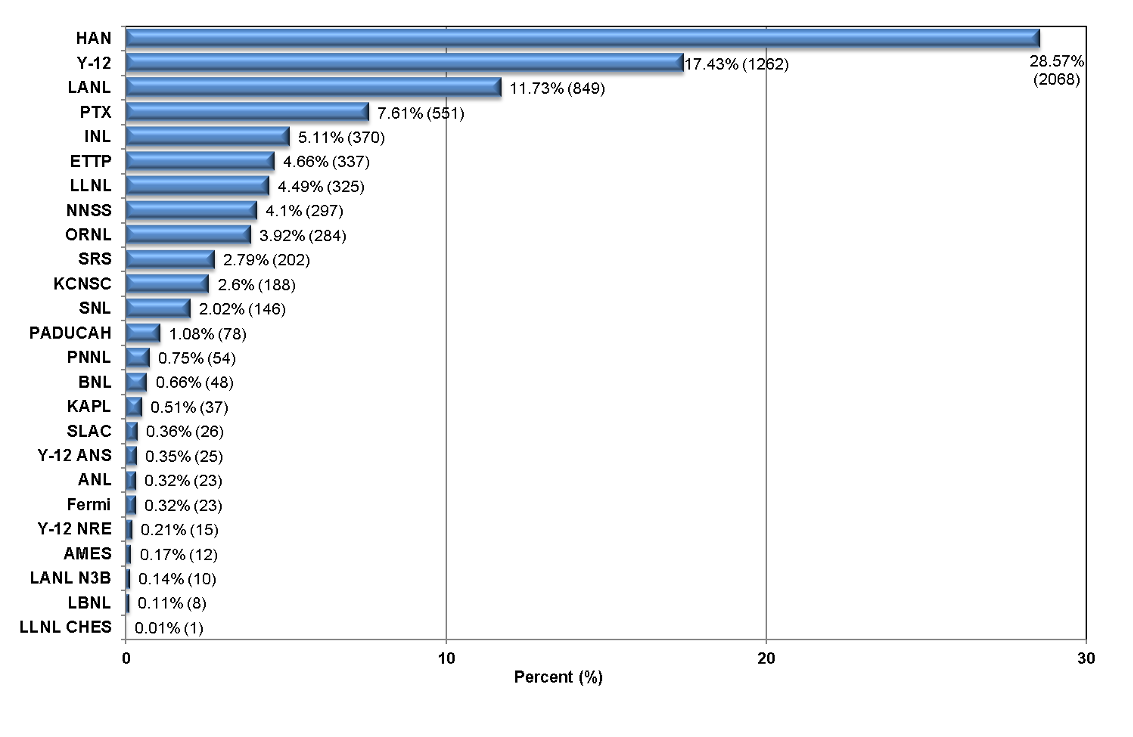
This figure displays the cumulative 7,239 beryllium-associated workers monitored for beryllium exposure through CY2019 by reporting organization.
*Some reporting organizations have provided data that predate the 2002 start date of the registry.
Exposure Monitoring Trends - Samples
-
Number and Percent Proportion of Exposure Sample Results by Year (N=60,223) (2010-2019).
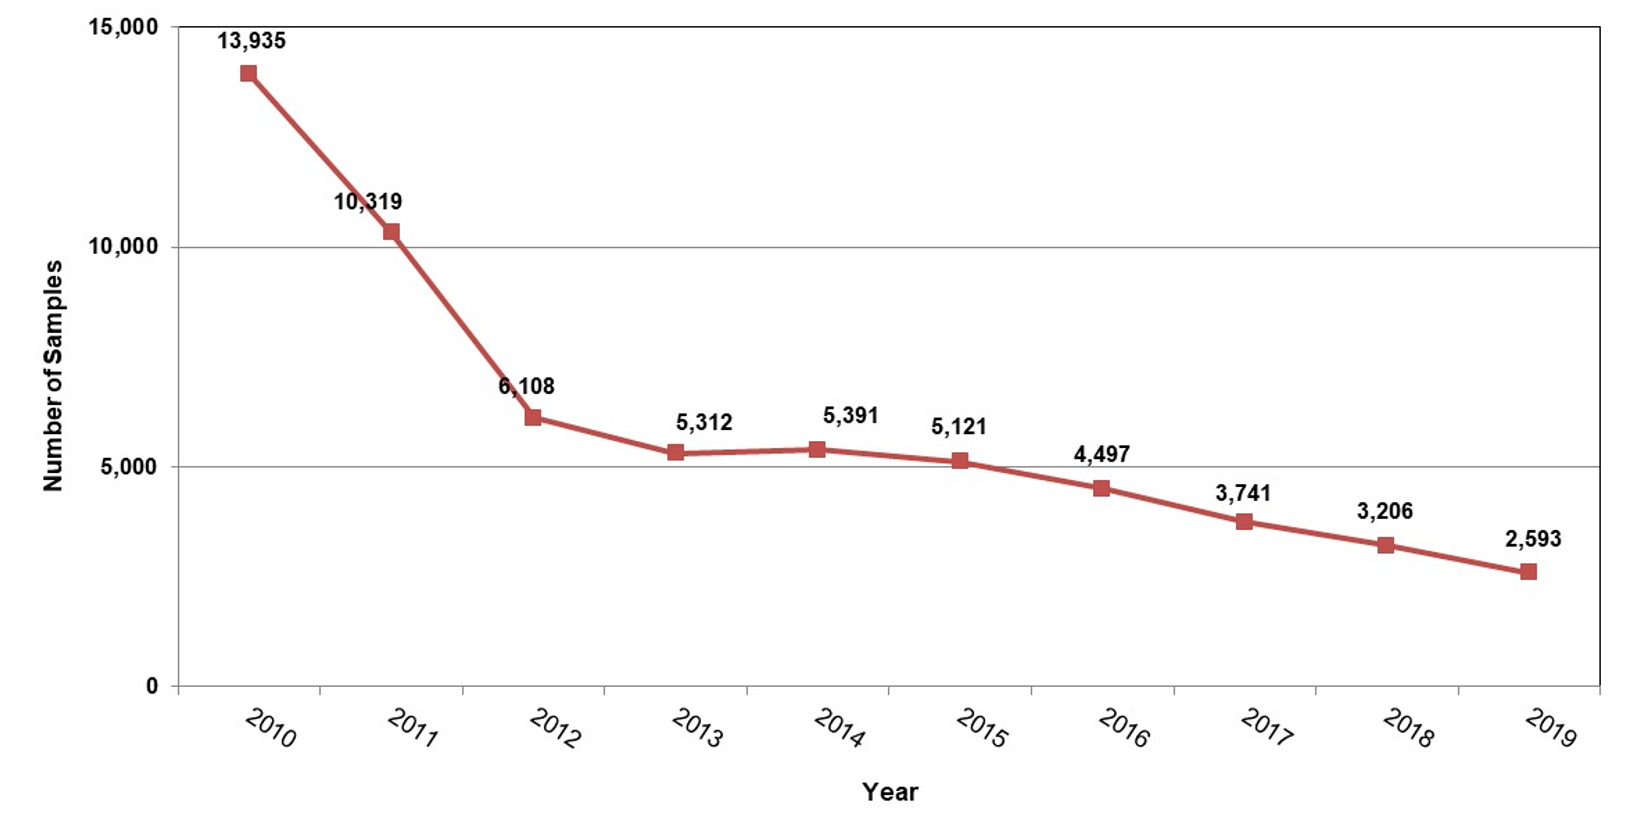
The numbers of exposure sampling results in the Registry by year monitored for each of the past 10 years are shown in the line chart.
As can be seen, the numbers have steadily declined in recent years. The reporting organizations that collected and submitted exposure monitoring sample data show a downward trend which, in some cases, impact the analysis and interpretation of results in the BAWR. The small sample size reduces accuracy and causes higher variability in the statistical models used for the BAWR analyses.
-
Comparison of the Number and Percent Proportion of Exposure Samples to Workers with Exposure Sampling Results by Reporting Organizations (n=2,593) (2002-2019)
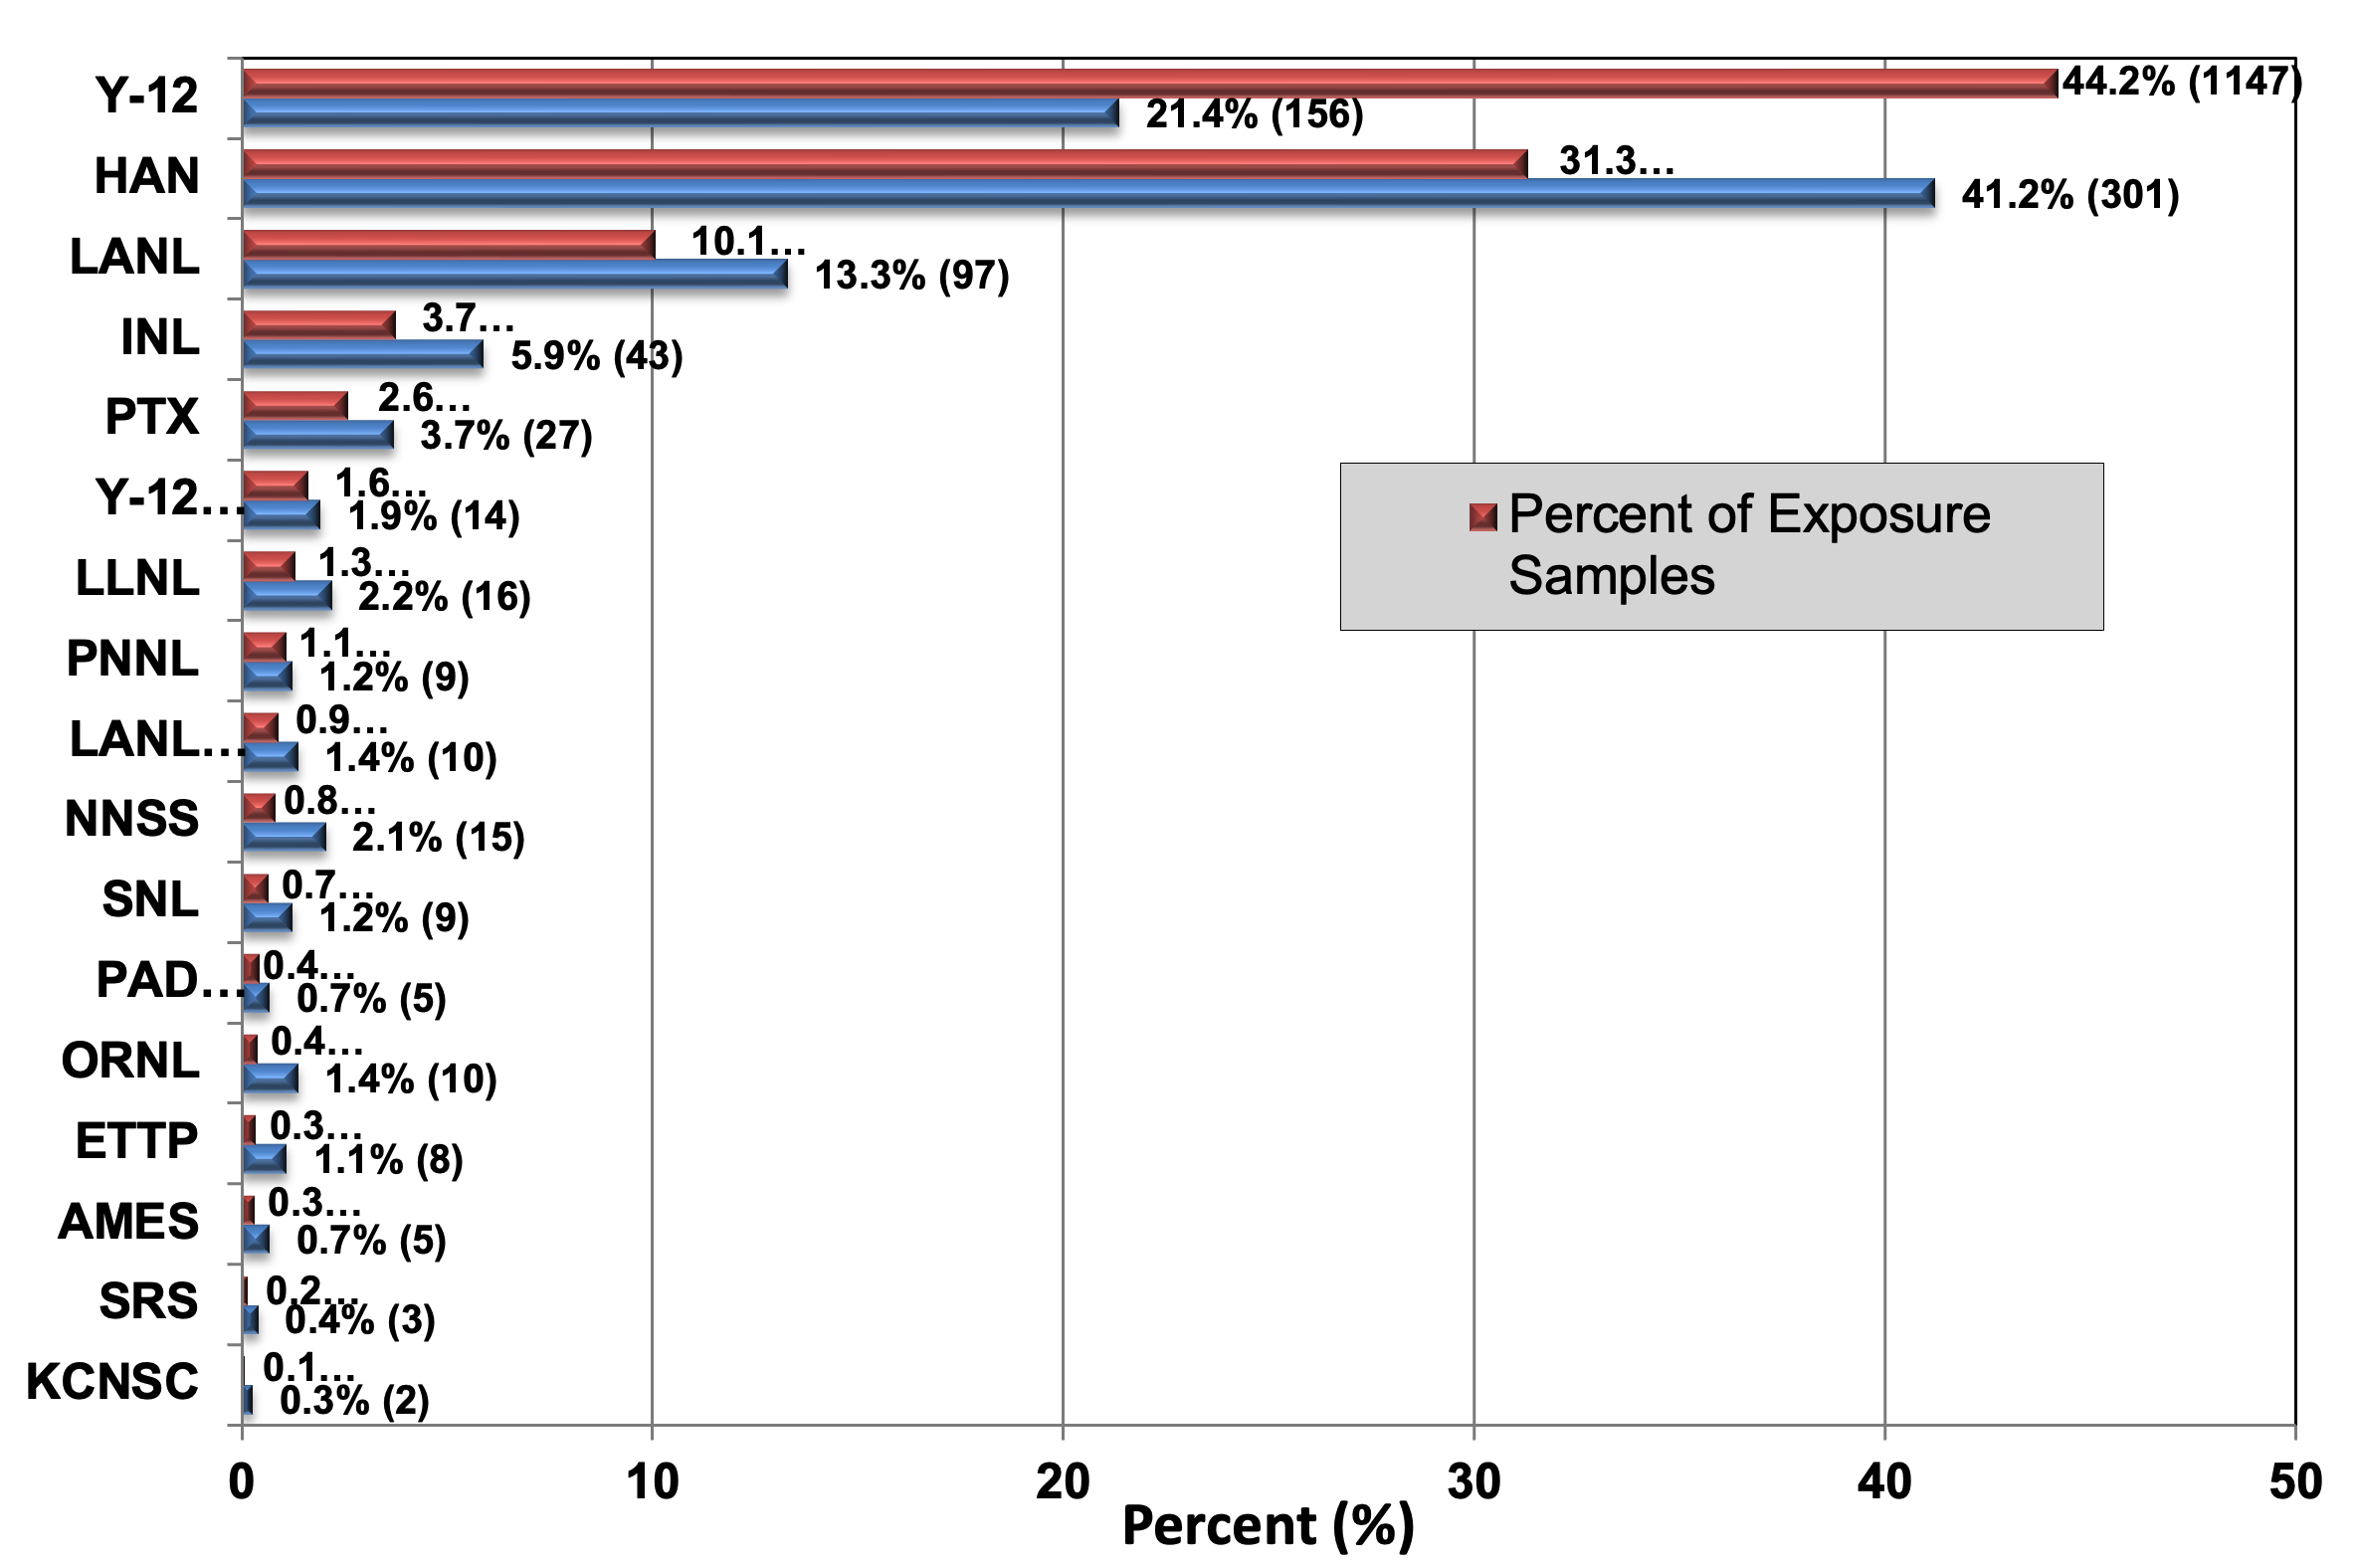
This graphic illustrates the distribution of exposure samples and employees monitored across 17 reporting organizations during 2019. Similar to the beryllium screening results, most employees monitored for beryllium exposure have multiple exposure measurements throughout the year. The frequency of monitoring is dependent on the employee’s specific type of work and their employer’s monitoring schemes.
Reporting organizations submitted a total of 110,905 exposure measurements to the Registry through CY2019. This equates to an additional 3,048 exposure sampling results collected and submitted to the 107,857 total through CY2018. The number of monitoring results for CY2019 alone was 2,593 as indicated above. Therefore, 455 of the sampling results submitted in CY2019 were sampling data for years prior to 2019.
-
Number and Percent Proportion of Non-Detectable Results Exposure Measurements, Detectable Exposure Measurement Results and Exposure Measurement Status Not Reported (N=110,905) (2002-2019)*
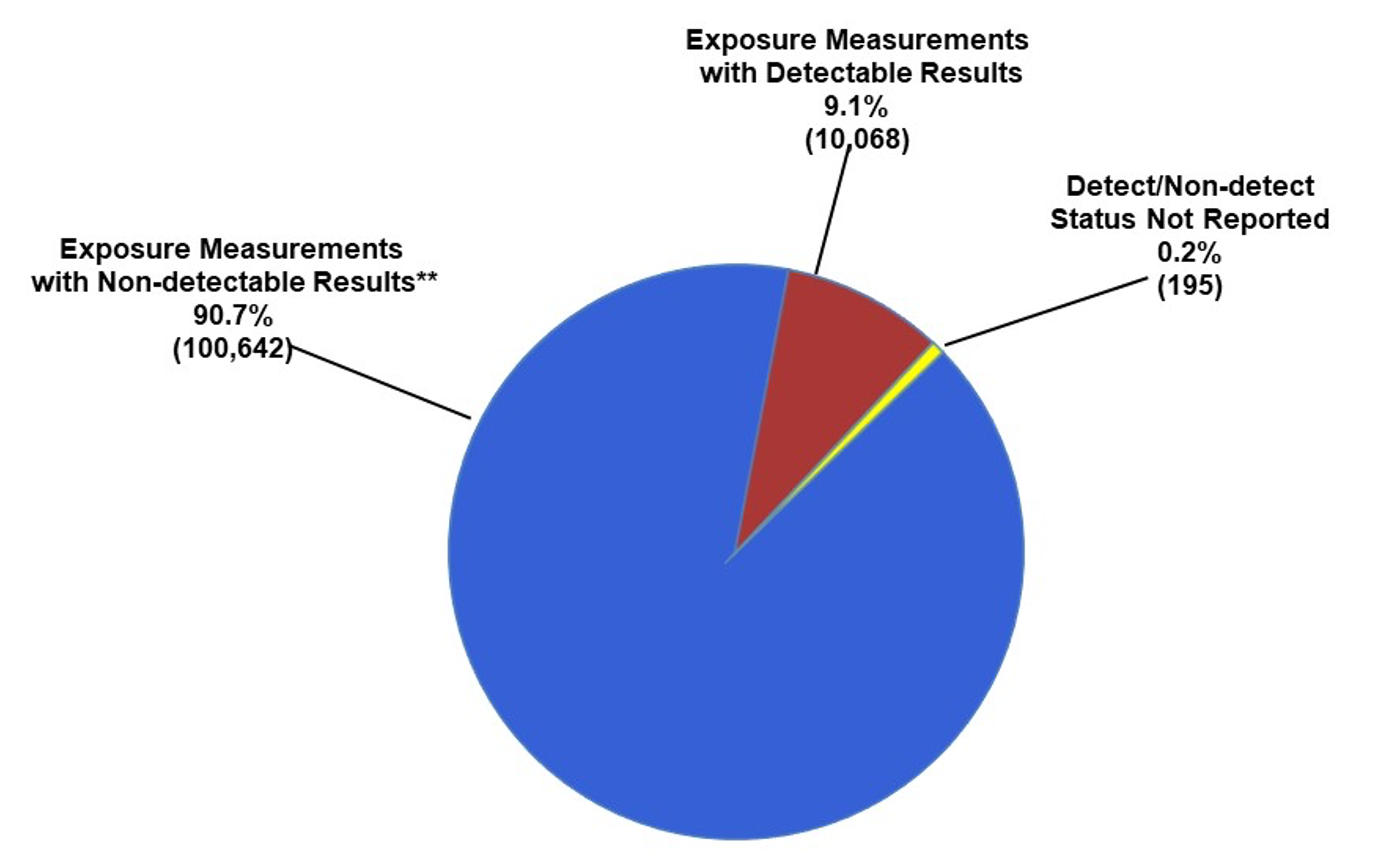
Of the 110,905 exposure monitoring records submitted to the Registry through CY2019, 90.7% have “non-detectable” results, indicating that the sample analysis results were less than the laboratory’s reporting limit. The reporting limit can vary from sample to sample because of differing flow rates of the sampling equipment used and because of the presence of other materials on the sample that can interfere with the analysis. Reporting limits typically vary from 0.01 to 0.05 µg/m3, which is one-twentieth to one-quarter of the action level of 0.2 µg/m3.
In comparison, 107,857 cumulative exposure monitoring results were submitted through CY2018, for an increase through 2019 of 3,048 records (with monitoring dates in 2019 and earlier). This 3,048 increase in sampling results is lower than the 3,104 increase in records submitted between 2017 and 2018 and even lower than the 3,584 increase between 2016 and 2017.
*Some reporting organizations have provided data that predate the 2002 start date of the registry.
**Non-detectable indicates that analysis results were reported as less than the laboratory's reporting limit.
Trends in Exposure Levels
-
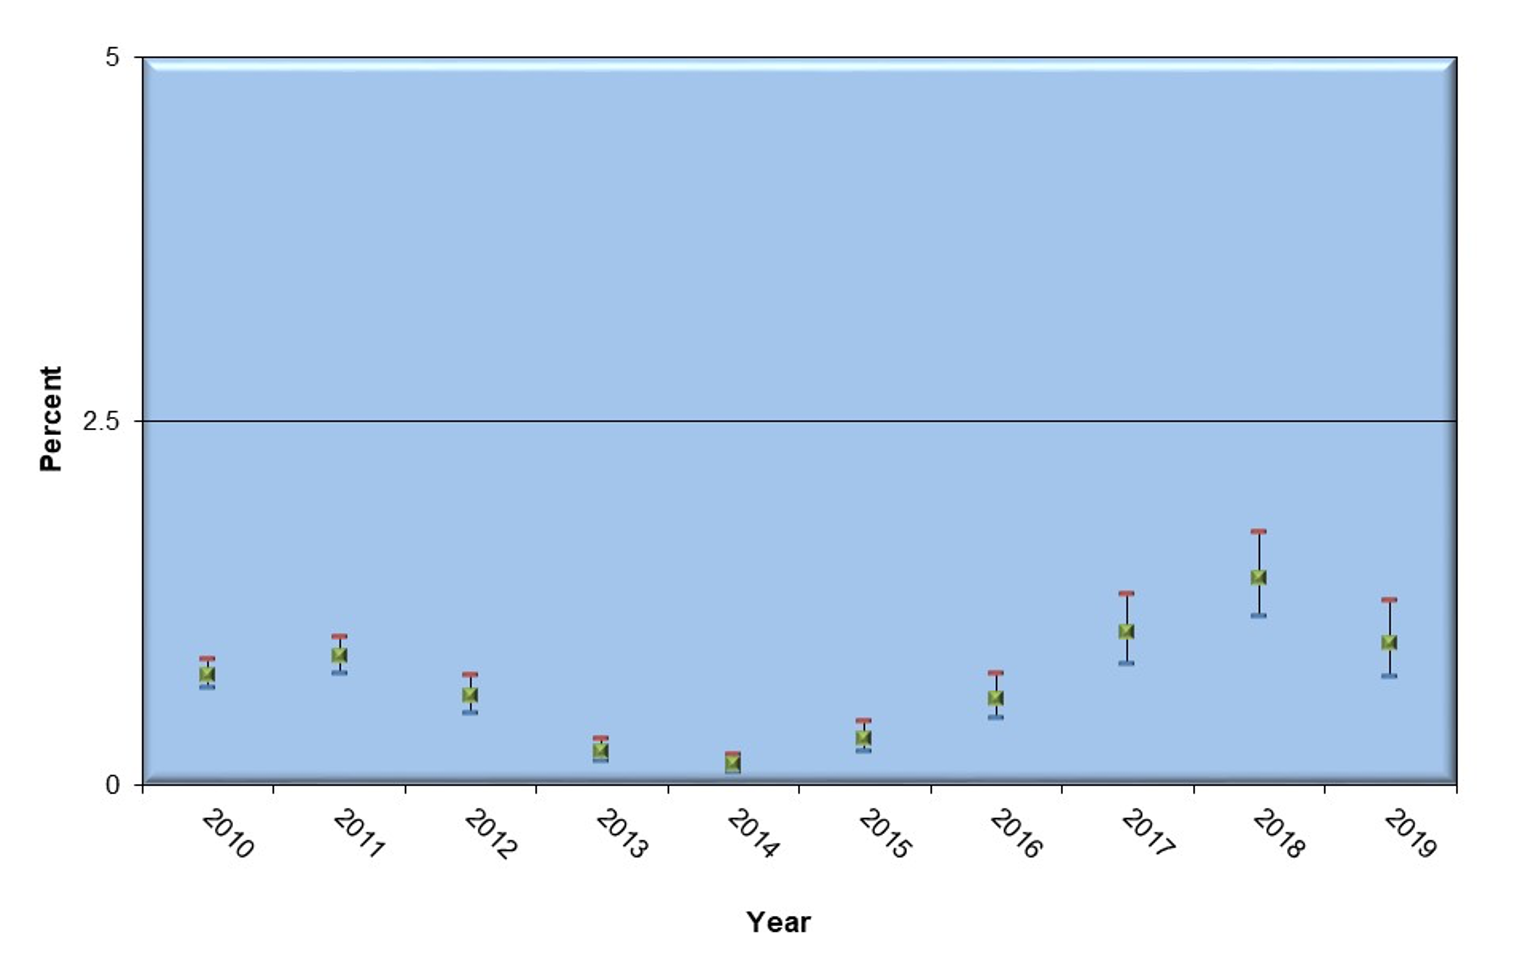
Percent of 8-hour time weighted average (TWA) Exceeding Action Level 0.2 µg/m3 by Year (2010-2019)
Mouse over or click a data point to view additional information.
Percent exceeding 0.2 μg/m3 based on 95% Confidence Limits
This figure shows the percent of DOE-wide 8-hour time weighted average (TWA) personal exposure monitoring results that exceeded the action level of 0.2 μg/m3 in each of the 10 years from 2010 to 2019.
Summary Statistics for 2010 – 2019 8-Hour Time Weighted Average Exposure Monitoring Results Year 2010 2011 2012 2013 2014 2015 2016 2017 2018 2019 10-year Summary Number of reported monitoring results 13,385 (22.7%) 10,195 (17.3%) 6,056 (10.3%) 5,281 (9%) 5,349 (9.1%) 5,062 (8.6%) 4,455 (7.6%) 3,405 (5.8%) 3,154 (5.4%) 2,543 (4.3%) 58,885 (100%) Number of detected values 624 (22.1%) 527 (18.6%) 302 (10.7%) 216 (7.6%) 177 (6.3%) 170 (6%) 240 (8.5%) 175 (6.2%) 240 (8.5%) 157 (5.6%) 2,828 (100%) Percent non-detects 95.3 94.8 95.0 95.9 96.7 96.6 94.6 94.9 92.4 93.8 95.2 Number of individuals monitored 1,179 (28.7%) 1,101 (26.8%) 826 (20.1%) 787 (19.2%) 827 (20.2%) 711 (17.3%) 693 (16.9%) 730 (17.8%) 682 (16.6%) 730 (17.8%) 4,103* (100%) Arithmetic mean (EX) (µg/m3) 0.052 0.096 0.032 0.004 0.002 0.008 0.016 0.842 0.360 0.182 0.041 Lower confidence limit of EX (µg/m3) 0.029 0.047 0.015 0.003 0.002 0.004 0.008 0.128 0.099 0.040 0.031 Upper confidence limit of EX (µg/m3) 0.092 0.197 0.069 0.006 0.003 0.017 0.032 5.521 1.310 0.830 0.053 Observed 95th percentile of data (µg/m3) 0.009 0.009 0.007 0.005 0.004 0.004 0.005 0.006 0.020 0.011 0.007 95% upper tolerance limit of the 95th percentile (µg/m3) 0.020 0.021 0.017 0.015 0.017 0.017 0.020 0.020 0.030 0.026 0.020 Largest value (µg/m3) 79.330 18.023 4.013 0.804 0.876 1.847 8.865 87.419 16.712 23.084 87.419 Percent exceeding 0.2 µg/m3 (F) 0.8 0.9 0.6 0.2 0.1 0.3 0.6 1.0 1.4 1.0 0.7 Lower confidence limit for F 0.7 0.8 0.5 0.2 0.1 0.2 0.5 0.8 1.2 0.7 0.6 Upper confidence limit for F 0.9 1.0 0.8 0.3 0.2 0.4 0.8 1.3 1.7 1.3 0.7 *Many individuals were monitored in more than 1 year. The total number of individuals measured at least once in the 10-year period from 2010 through 2019 is 4,103.
The detailed data presented in the table above provide additional summary statistics for the DOE-wide 8-hour TWA results for each of the past 10 years. The very high percentage of non-detected results from workplaces compliant with the 0.2 µg/m3 action level points to the need to develop more sensitive exposure monitoring methods to support estimates of individuals’ actual exposure levels.
These statistical methods accommodate the high percentage of non-detect results (left censored) in these data sets. These analyses exclude non-detected values greater than 0.2 µg/m3. For details, see “Statistical Methods and Software for the Analysis of Occupational Exposure Data with Non-Detectable Values” Frome EL and Wambach PF, ORNL/TM-2005/52.
Totals for an individual year may vary from previous reports due to late reporting and/or corrections. The data reported in the BAWR indicate that the CBD prevention programs operated at DOE sites have continued to maintain a high level of compliance with the 10 CFR 850 action level of 0.2 µg/m3 over the past 10 years.
2010
Upper confidence limit for F: 0.9
Percent exceeding 0.2 µg/m3 (F): 0.8
Lower confidence limit for F: 0.7
2011
Upper confidence limit for F: 1.0
Percent exceeding 0.2 µg/m3 (F): 0.9
Lower confidence limit for F: 0.8
2012
Upper confidence limit for F: 0.8
Percent exceeding 0.2 µg/m3 (F): 0.6
Lower confidence limit for F: 0.5
2013
Upper confidence limit for F: 0.3
Percent exceeding 0.2 µg/m3 (F): 0.2
Lower confidence limit for F:</strong >0.2
2014
Upper confidence limit for F: 0.2
Percent exceeding 0.2 µg/m3 (F): 0.1
Lower confidence limit for F: 0.1
2015
Upper confidence limit for F: 0.4
Percent exceeding 0.2 µg/m3 (F): 0.3
Lower confidence limit for F: 0.2
2016
Upper confidence limit for F: 0.8
Percent exceeding 0.2 µg/m3 (F): 0.6
Lower confidence limit for F: 0.5
2017
Upper confidence limit for F: 1.3
Percent exceeding 0.2 µg/m3 (F): 1.1
Lower confidence limit for F: 0.8
2018
Upper confidence limit for F: 1.7
Percent exceeding 0.2 µg/m3 (F): 1.4
Lower confidence limit for F: 1.2
2019
Upper confidence limit for F: 1.3
Percent exceeding 0.2 µg/m3 (F): 1.0
Lower confidence limit for F: 0.7
Exceedances Observed through 2019
-
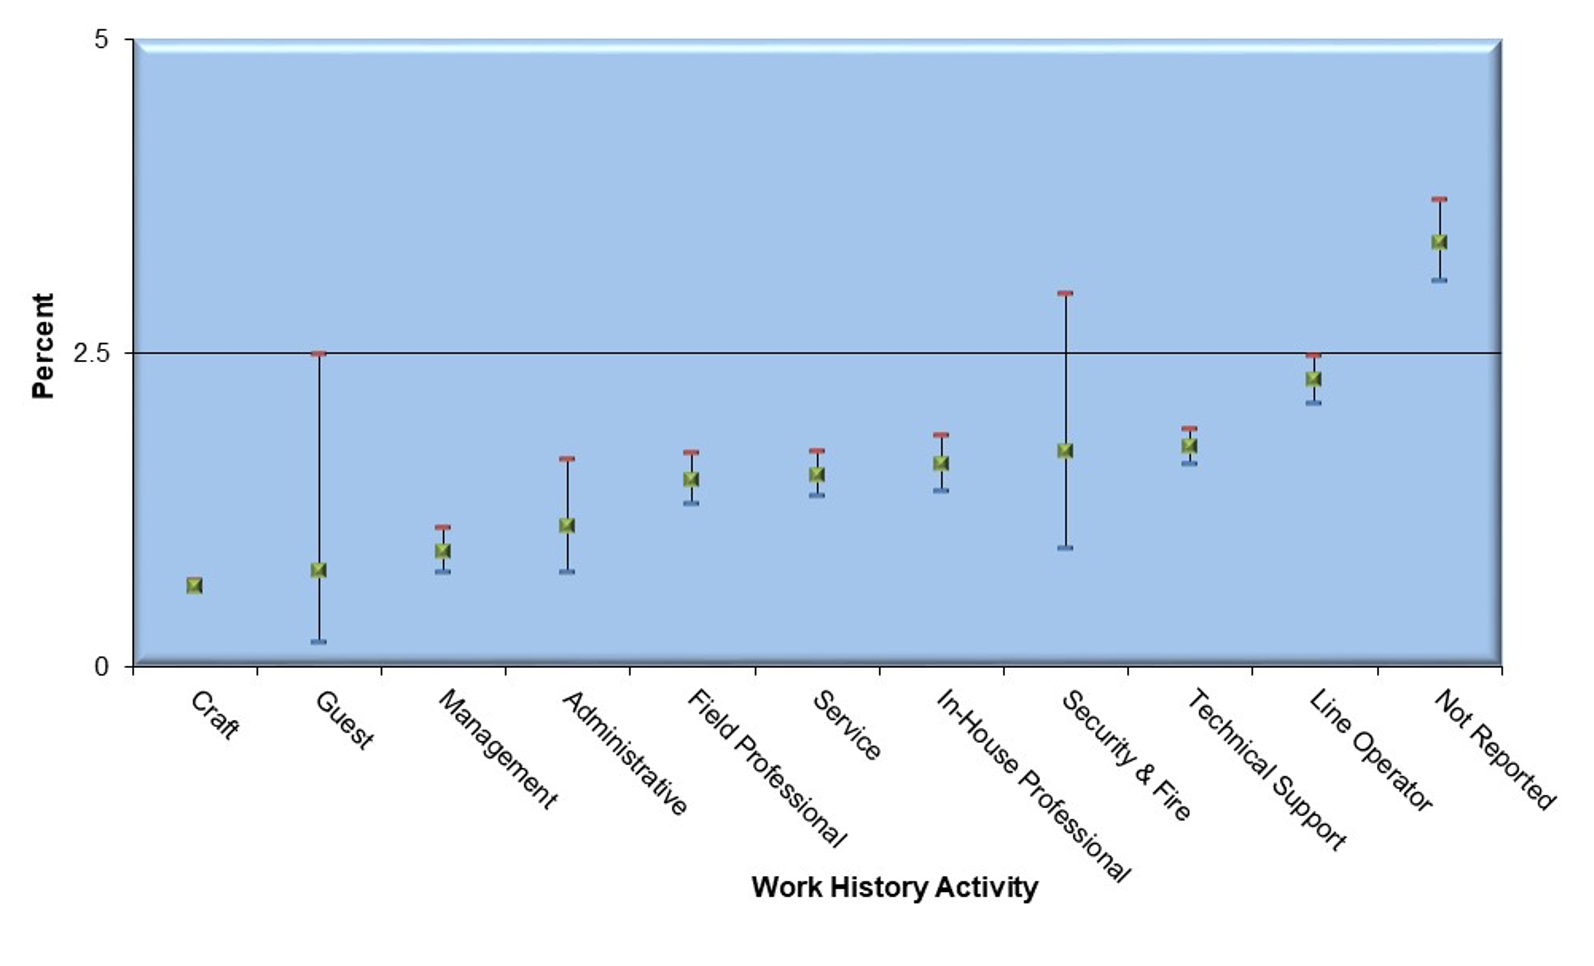
Percent of 8-hour time weighted average (TWA) Exceeding Action Level 0.2 µg/m3 by Work History Activity (2002-2019)*
Mouse over or click a data point to view additional information.
Percent exceeding 0.2 μg/m3 based on 95% Confidence Limits
The graphic shows the percent of 8-hour TWA exposure monitoring results that exceed the action level, grouped by work activity for the cumulative data through 2019. The detailed data in the table provide additional summary statistics for the composite 8-hour TWA results by work activity.
For the cumulative data, the highest percentage of action level exceedances by work history activity is among workers where the work activity is unknown or not reported.
Summary Statistics for 8-hour time weighted average (TWA) Exceeding Action Level 0.2 μg/m3 by Work History Activity (2002-2019)* Work History Activity Admin. Craft Field Prof. Guest In-house Prof. Line Operator Management Security & Fire Service Tech Support Not Reported Total No. reported monitoring results 1,059 (1%) 49,437 (46%) 6,063 (6%) 97 (0%) 5,414 (5%) 11,268 (11%) 4,473 (4%) 390 (0%) 8,801 (8%) 14,457 (14%) 5,144 (5%) 106,603 (100%) No. detected values 81 (1%) 2,921 (25%) 686 (6%) 28 (0%) 694 (6%) 1,998 (17%) 544 (5%) 14 (0%) 707 (6%) 2,192 (19%) 1,709 (15%) 11,574 (100%) % non-detects 92.4 94.1 88.7 71.1 87.2 82.3 87.8 96.4 92.0 84.8 66.8 89.1 No. individuals monitored 82 (1%) 2,256 (32%) 666 (9%) 8 (0%) 319 (4%) 1,176 (16%) 300 (4%) 70 (1%) 654 (9%) 1,214 (17%) 406 (6%) 7,151 (100%) Observed 95th percentile of data (ug/m3) 0.021 0.008 0.027 0.027 0.047 0.059 0.022 0.002 0.020 0.052 0.130 0.026 95% UTL of 95th percentile (ug/m3) 0.050 0.050 0.070 0.291 0.055 0.099 0.050 0.050 0.050 0.080 0.170 0.052 Largest value (ug/m3) 21.771 87.419 26.678 0.313 12.611 134.000 11.762 11.700 84.933 29.852 7.670 134.000 % > 0.2 ug/m3 (F) 1.1 0.6 1.5 0.8 1.6 2.3 0.9 1.7 1.5 1.7 3.4 1.3 Lower confidence limit for F 0.8 0.6 1.3 0.2 1.4 2.1 0.8 0.9 1.4 1.6 3.1 1.3 Upper confidence limit for F 1.6 0.7 1.7 2.5 1.8 2.5 1.1 3.0 1.7 1.9 3.7 1.4 *Some reporting organizations have provided data that predate the 2002 start date of the registry. Percent exceeding 0.2 μg/m3 based on 95% Confidence Limits.
Crafts
Upper confidence limit for F: 0.7
Percent exceeding 0.2 µg/m3 (F): 0.6
Lower confidence limit for F: 0.6
Guests
Upper confidence limit for F: 2.5
Percent exceeding 0.2 µg/m3 (F): 0.8
Lower confidence limit for F: 0.2
Management
Upper confidence limit for F: 1.1
Percent exceeding 0.2 µg/m3 (F): 0.9
Lower confidence limit for F: 0.8
Administrative
Upper confidence limit for F: 1.6
Percent exceeding 0.2 µg/m3 (F): 1.1
Lower confidence limit for F: 0.8
Field Professionals
Upper confidence limit for F: 1.7
Percent exceeding 0.2 µg/m3 (F): 1.5
Lower confidence limit for F: 1.3
Service
Upper confidence limit for F: 1.7
Percent exceeding 0.2 µg/m3 (F): 1.5
Lower confidence limit for F: 1.4
In-house Professionals
Upper confidence limit for F: 1.8
Percent exceeding 0.2 µg/m3 (F): 1.6
Lower confidence limit for F: 1.4
Security & Fire
Upper confidence limit for F: 3.0
Percent exceeding 0.2 µg/m3 (F): 1.7
Lower confidence limit for F: 0.9
Technical Support
Upper confidence limit for F: 1.9
Percent exceeding 0.2 µg/m3 (F): 1.7
Lower confidence limit for F: 1.6
Line Operators
Upper confidence limit for F: 2.5
Percent exceeding 0.2 µg/m3 (F): 2.3
Lower confidence limit for F: 2.1
Not Reported
Upper confidence limit for F: 3.7
Percent exceeding 0.2 µg/m3 (F): 3.4
Lower confidence limit for F: 3.1
-
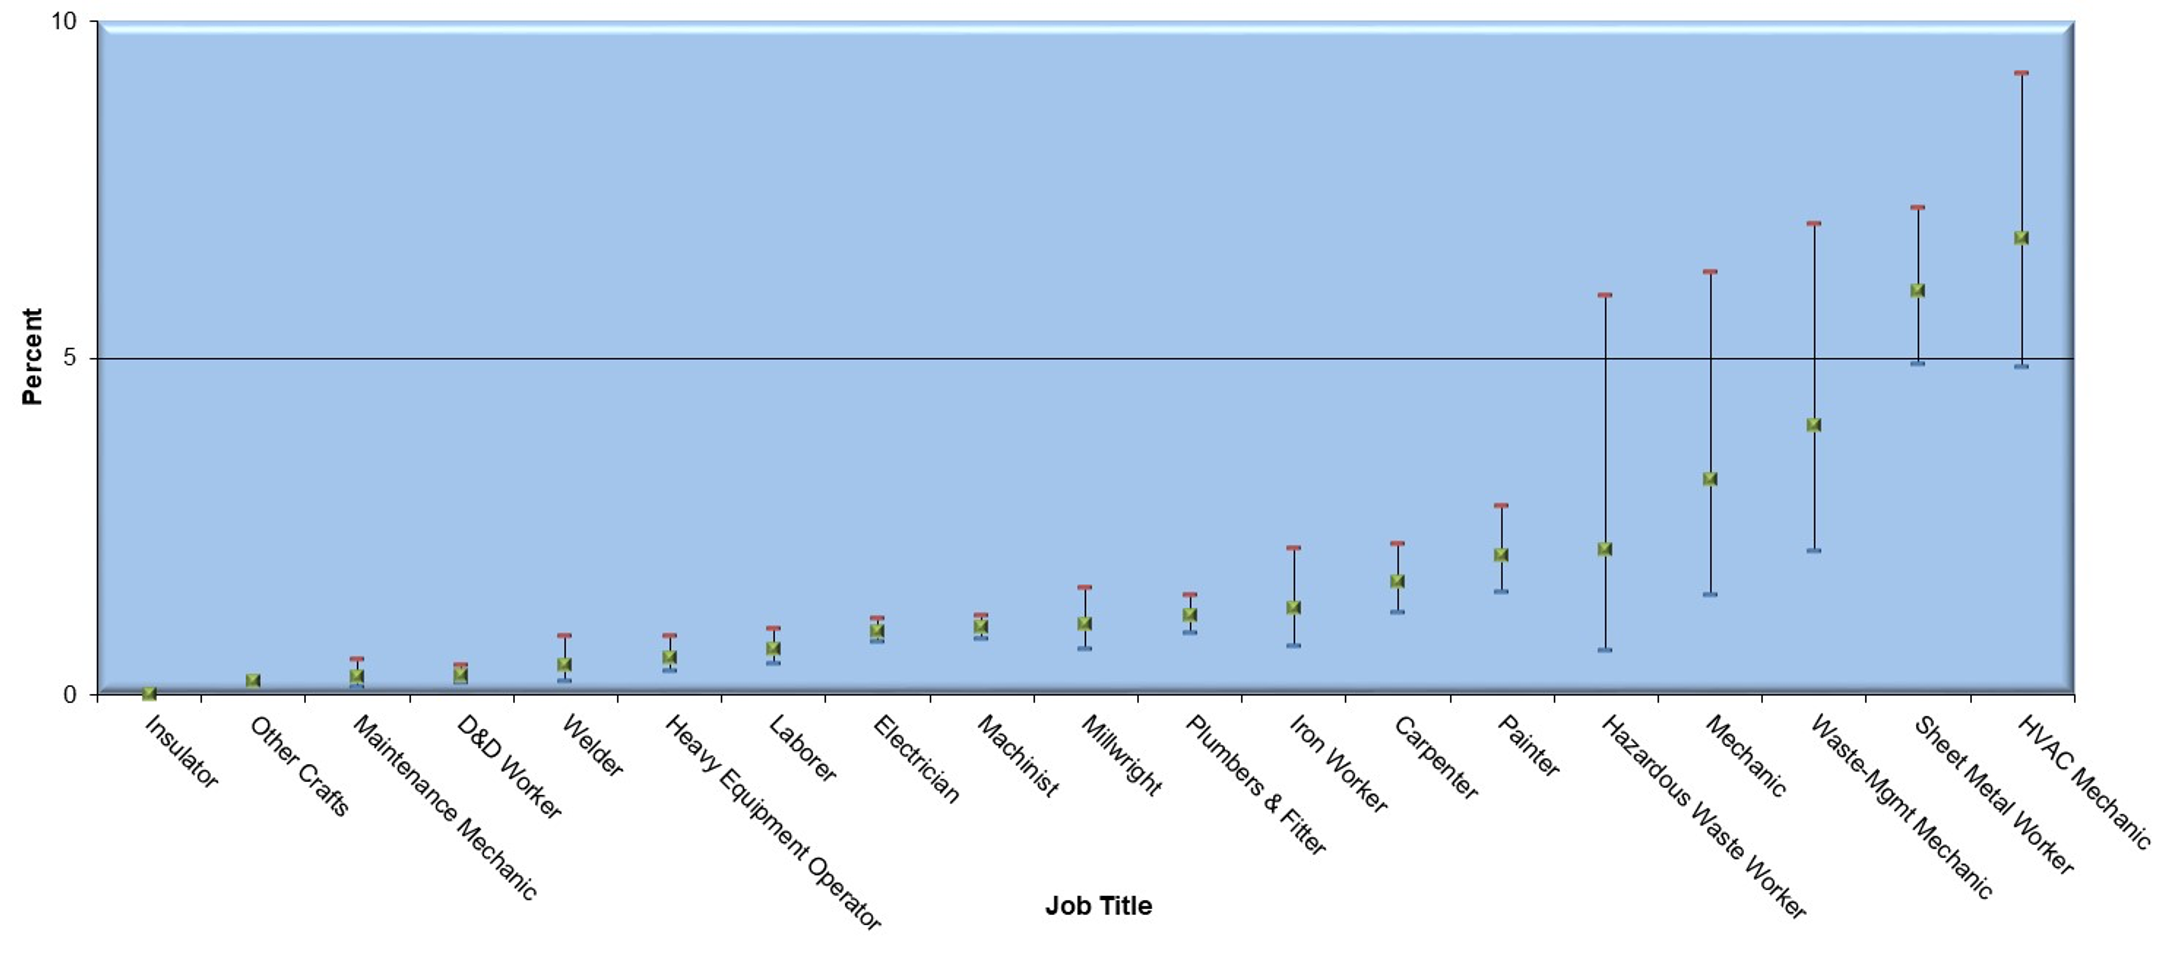
Percent of 8-hour time weighted average (TWA) Exceeding Action Level 0.2 µg/m3 by Job Title (2002-2019)*
Mouse over or click a data point to view additional information.
Percent exceeding 0.2 μg/m3 based on 95% Confidence Limits
*Some reporting organizations have provided data that predate the 2002 start date of the registry.This graphic shows individuals with job titles in the craft work activity category. The detailed data through 2019 presented in the accompanying table include the summary statistics for cumulative 8-hour TWA monitoring results by craft job title. Laborers, machinists, electricians, millwrights, plumbers and fitters, iron workers, carpenters, hazardous waste workers, painters, mechanics, waste-management mechanics, sheet metal workers, and HVAC mechanics individually have percent exceedances that are higher than when all crafts are combined (0.7% to 6.8% as compared to 0.6%, as shown in the table below).
Among craft workers, HVAC mechanics and sheet metal workers show percentages exceeding the 0.2 µg/m3 action level that are higher than the percentages experienced by other craft workers. However, the percentage for HVAC mechanics reflects exposure monitoring results for only 29 individuals, and for sheet metal workers only 67 individuals.
Summary Statistics for 8-hour time weighted average (TWA) Exceeding Action Level 0.2 µg/m3 by Job Title (2002-2019)* Craft Job Title Number of reported monitoring results Number of detected values Percent non-detects Number of individuals monitored Observed 95th% of data (ug/m3) 95% UTL of 95th% (µg/m3) Largest value (ug/m3) Percent exceeding 0.2 ug/m3 (F) Lower confidence limit for F Upper confidence limit for F Insulators 678 (1%) 208 (7%) 69.3 32 (1%) 0.009 0.030 0.200 < 0.1 < 0.1 < 0.1 Other Crafts 24,637 (50%) 481 (16%) 98.0 258 (11%) 0.005 0.017 37.300 0.2 0.2 0.2 Maintenance Mechanics 979 (2%) 31 (1%) 96.8 108 (5%) 0.002 0.052 0.200 0.3 0.1 0.5 D&D Workers 1,268 (3%) 214 (7%) 83.1 151 (7%) 0.029 0.039 2.475 0.3 0.2 0.4 Welders 727 (1%) 35 (1%) 95.2 38 (2%) 0.008 0.024 0.356 0.4 0.2 0.9 Heavy Equipment Operators 1,211 (2%) 100 (3%) 91.7 114 (5%) 0.005 0.021 16.697 0.6 0.3 0.9 Laborers 1,746 (4%) 86 (3%) 95.1 268 (12%) 0.009 0.053 10.340 0.7 0.5 1.0 Electricians 4,622 (9%) 448 (15%) 90.3 398 (18%) 0.021 0.050 14.419 0.9 0.8 1.1 Machinists 6,253 (13%) 311 (11%) 95.0 118 (5%) 0.013 0.050 87.419 1.0 0.8 1.2 Millwrights 928 (2%) 62 (2%) 93.3 152 (7%) 0.008 0.050 20.176 1.0 0.7 1.6 Plumbers & Fitters 2,610 (5%) 215 (7%) 91.8 234 (10%) 0.017 0.050 5.735 1.2 0.9 1.5 Iron Workers 318 (1%) 97 (3%) 69.5 44 (2%) 0.122 0.253 1.847 1.3 0.7 2.2 Carpenters 1,213 (2%) 116 (4%) 90.4 114 (5%) 0.039 0.055 3.176 1.7 1.2 2.2 Painters 848 (2%) 199 (7%) 76.5 49 (2%) 0.081 0.122 7.423 2.1 1.5 2.8 Hazardous Waste Workers 93 (0%) 9 (0%) 90.3 19 (1%) 0.071 0.167 0.176 2.1 0.6 5.9 Mechanics 118 (0%) 22 (1%) 81.4 41 (2%) 0.017 0.091 0.137 3.2 1.5 6.3 Waste-Mgmt Mechanics 147 (0%) 17 (1%) 88.4 15 (1%) 0.093 1.290 2.390 4.0 2.1 7.0 Sheet Metal Workers 787 (2%) 172 (6%) 78.1 74 (3%) 0.380 0.609 8.865 6.0 4.9 7.2 HVAC Mechanics 254 (1%) 98 (3%) 61.4 29 (1%) 0.282 0.494 5.836 6.8 4.9 9.2 All Combined 49,437 (100%) 2,921 (100%) 94.1 2,256 (100%) 0.008 0.050 87.419 0.6 0.6 0.7 Insulators
Upper confidence limit for F: < 0.1
Percent exceeding 0.2 µg/m3 (F): < 0.1
Lower confidence limit for F: < 0.1
Other Crafts
Upper confidence limit for F: 0.2
Percent exceeding 0.2 µg/m3 (F): 0.2
Lower confidence limit for F: 0.2
Maintenance Mechanics
Upper confidence limit for F: 0.5
Percent exceeding 0.2 µg/m3 (F): 0.3
Lower confidence limit for F: 0.1
D&D Workers
Upper confidence limit for F: 0.4
Percent exceeding 0.2 µg/m3 (F): 0.3
Lower confidence limit for F: 0.2
Welders
Upper confidence limit for F: 0.9
Percent exceeding 0.2 µg/m3 (F): 0.4
Lower confidence limit for F: 0.2
Heavy Equipment Operators
Upper confidence limit for F: 0.9
Percent exceeding 0.2 µg/m3 (F): 0.6
Lower confidence limit for F: 0.3
Laborers
Upper confidence limit for F: 1.0
Percent exceeding 0.2 µg/m3 (F): 0.7
Lower confidence limit for F: 0.5
Electricians
Upper confidence limit for F: 1.1
Percent exceeding 0.2 µg/m3 (F): 0.9
Lower confidence limit for F: 0.8
Machinists
Upper confidence limit for F: 1.2
Percent exceeding 0.2 µg/m3 (F): 1.0
Lower confidence limit for F: 0.8
Millwrights
Upper confidence limit for F: 1.6
Percent exceeding 0.2 µg/m3 (F): 1.0
Lower confidence limit for F: 0.7
Plumbers & Fitters
Upper confidence limit for F: 1.5
Percent exceeding 0.2 µg/m3 (F): 1.2
Lower confidence limit for F: 0.9
Iron Workers
Upper confidence limit for F: 2.2
Percent exceeding 0.2 µg/m3 (F): 1.3
Lower confidence limit for F: 0.7
Carpenters
Upper confidence limit for F: 2.2
Percent exceeding 0.2 µg/m3 (F): 1.7
Lower confidence limit for F: 1.2
Painters
Upper confidence limit for F: 2.8
Percent exceeding 0.2 µg/m3 (F): 2.1
Lower confidence limit for F: 1.5
Hazardous Waste Workers
Upper confidence limit for F: 5.9
Percent exceeding 0.2 µg/m3 (F): 2.1
Lower confidence limit for F: 0.6
Mechanics
Upper confidence limit for F: 6.3
Percent exceeding 0.2 µg/m3 (F): 3.2
Lower confidence limit for F: 1.5
Waste-Mgmt Mechanics
Upper confidence limit for F: 7.0
Percent exceeding 0.2 µg/m3 (F): 4.0
Lower confidence limit for F: 2.1
Sheet Metal Workers
Upper confidence limit for F: 7.2
Percent exceeding 0.2 µg/m3 (F): 6.0
Lower confidence limit for F: 4.9
HVAC Mechanics
Upper confidence limit for F: 9.2
Percent exceeding 0.2 µg/m3 (F): 6.8
Lower confidence limit for F: 4.9
-
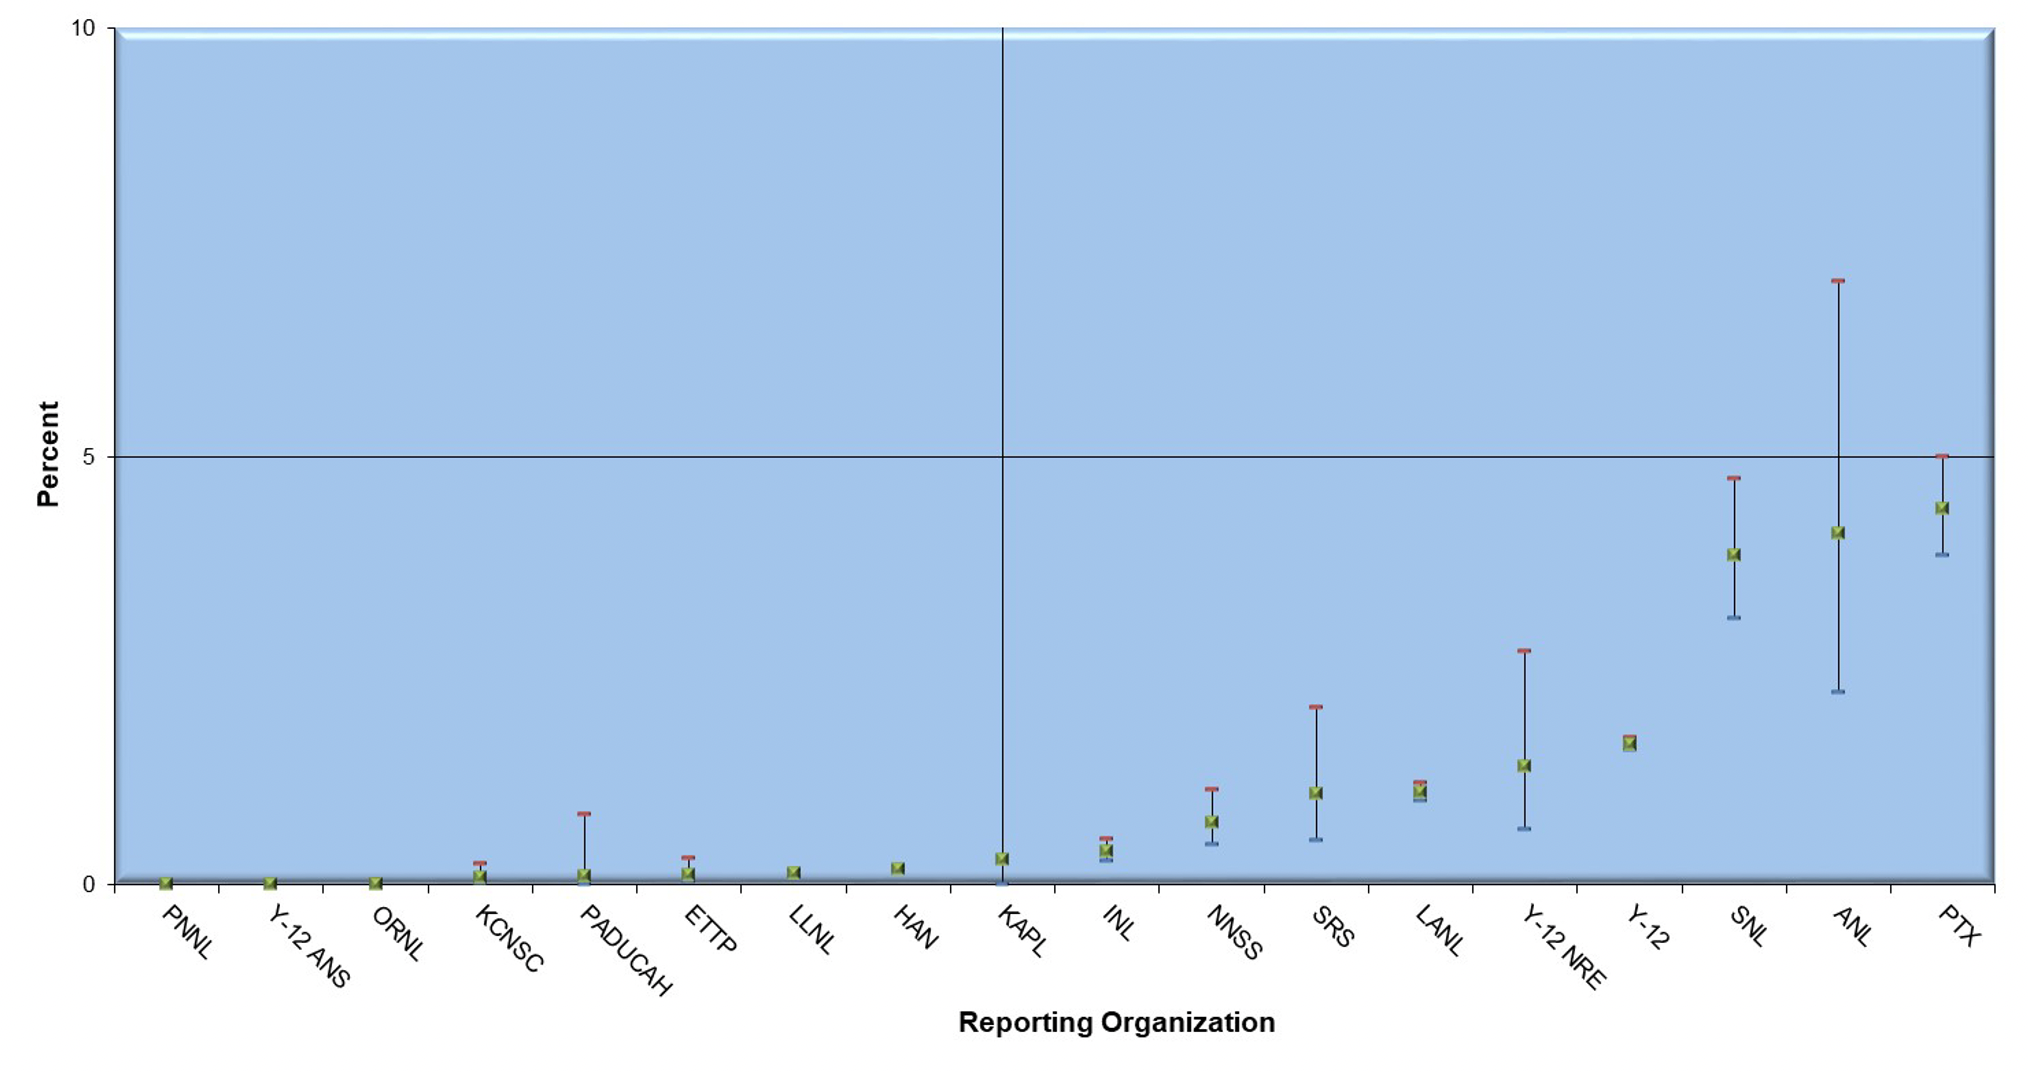
Percent of 8-hour time weighted average (TWA) Exceeding Action Level 0.2 µg/m3 by Reporting Organization (2002-2019)*
Mouse over or click a data point to view additional information.
Percent exceeding 0.2 μg/m 3 based on 95% Confidence Limits
This chart summarizes the cumulative 8-hour TWA exposure monitoring results through 2018 by reporting organization. The detailed data presented below include the summary statistics for the cumulative 8-hour TWA monitoring results for each reporting organization. The percent of monitoring results exceeding the action level at Fermi (not included in the graphic above due to the very large value, 17.2%, exceeding the scale for the figure), Y-12 NRE, Y-12, SNL, ANL, and PTX (ranging from 1.4 to 4.6%) were higher than the overall percent exceedances when data across all organizations are combined (1.3%).
The graphic does not include results from AMES, BNL, Fermi, LBNL, LLNL CHES, and SLAC because of the small number of total samples and/or low percent exceeding the action level. Collectively, these data indicate that the majority of reporting organizations have acceptable sampling programs. However, the data also show that some organizations with ongoing beryllium activities, but small numbers of exposure monitoring samples could revisit their sampling strategies and consider increasing the volume of sampling.
Summary Statistics for 8-hour time weighted average (TWA) Exceeding Action Level 0.2 μg/m3 by Reporting Organization (2002-2019)* Reporting Organization No. monitoring results No. detected values % non-detects No. individ. monitored Obs. 95th percentile (ug/m 3) 95% UTL /95th % (ug/m 3) Largest value (ug/m 3) % > 0.2 ug/m 3 (F) Lower confidence limit for F Upper confidence limit for F AMES 57 (0.1%) 3 (0%) 94.7 12 (0.2%) < 0.001 NA 0.028 0 0 91.1 ANL 155 (0.1%) 18 (0.2%) 88.4 10 (0.1%) 0.145 1.1 2.39 4.1 2.3 7 BNL 105 (0.1%) 2 (0%) 98.1 8 (0.1%) 0.002 0.1 0.1 0.5 < 0.1 50 ETTP 914 (0.9%) 32 (0.3%) 96.5 1 (0%) 0.007 0.08 2.264 0.1 < 0.1 0.3 Fermi 48 (0%) 22 (0.2%) 54.2 26 (0.4%) 1.296 NA 4.8 17.2 10.6 26.1 HAN 13,535 (12.7%) 1,618 (14%) 88 2,036 (29.9%) 0.008 0.019 12.513 0.2 0.2 0.2 INL 2,100 (2%) 375 (3.2%) 82.1 370 (5.4%) 0.033 0.088 2.475 0.4 0.3 0.5 KAPL 234 (0.2%) 2 (0%) 99.1 37 (0.5%) 0.007 0.2 0.2 0.3 < 0.1 27.5 KCNSC 1,668 (1.6%) 18 (0.2%) 98.9 186 (2.7%) 0.001 0.145 0.196 0.1 < 0.1 0.2 LANL 13,550 (12.7%) 2,663 (23%) 80.3 849 (12.5%) 0.042 0.005 26.678 1.1 1 1.1 LANL N3B 23 (0%) 1 (0%) 95.6 10 (0.1%) 0.005 NA 0.015 0 0 12.2 LBNL 18 (0%) 0 (0%) 100 8 (0.1%) 0.1 NA 0.1 0 0 15.3 LLNL 6,770 (6.4%) 1,178 (10.2%) 82.6 325 (4.8%) 0.021 0.033 5.133 0.1 0.1 0.2 LLNL CHES 3 (0%) 0 (0%) 100 1 (0%) 0.04 NA 0.042 0 0 63.2 NNSS 1,129 (1.1%) 101 (0.9%) 91.1 297 (4.4%) 0.014 0.052 0.317 0.7 0.5 1.1 ORNL 1,356 (1.3%) 8 (0.1%) 99.4 284 (4.2%) 0.002 0.011 0.157 < 0.1 < 0.1 < 0.1 PADUCAH 631 (0.6%) 4 (0%) 99.4 78 (1.1%) < 0.001 0.009 0.019 0.1 < 0.1 0.8 PNNL 213 (0.2%) 10 (0.1%) 95.3 54 (0.8%) 0.002 0.005 0.028 < 0.1 < 0.1 < 0.1 PTX 2,481 (2.3%) 282 (2.4%) 88.6 536 (7.9%) 0.2 0.3 134 4.4 3.9 5 SLAC 42 (0%) 0 (0%) 100 26 (0.4%) 0.04 NA 0.15 0 0 6.9 SNL 962 (0.9%) 359 (3.1%) 62.7 146 (2.1%) 0.112 0.16 3.82 3.8 3.1 4.7 SRS 366 (0.3%) 22 (0.2%) 94 201 (3%) 0.019 0.07 0.32 1.1 0.5 2.1 Y-12 59,783 (56.1%) 4,821 (41.7%) 91.9 1,262 (18.6%) 0.039 0.05 87.419 1.6 1.6 1.7 Y-12 ANS 169 (0.2%) 20 (0.2%) 88.2 25 (0.4%) 0.01 0.01 0.15 < 0.1 < 0.1 < 0.1 Y-12 NRE 291 (0.3%) 15 (0.1%) 94.8 15 (0.2%) 0.009 0.039 1.111 1.4 0.6 2.7 All 106,603 (100%) 11,574 (100%) 89.1 6,803 (100%) 0.026 0.052 134 1.3 1.3 1.4 PNNL
Upper confidence limit for F: < 0.1
Percent exceeding 0.2 µg/m3 (F): < 0.1
Lower confidence limit for F: < 0.1
Y-12 ANS
Upper confidence limit for F: < 0.1
Percent exceeding 0.2 µg/m3 (F): < 0.1
Lower confidence limit for F: < 0.1
ORNL
Upper confidence limit for F: < 0.1
Percent exceeding 0.2 µg/m3 (F): < 0.1
Lower confidence limit for F: < 0.1
KCNSC
Upper confidence limit for F: 0.2
Percent exceeding 0.2 µg/m3 (F): 0.1
Lower confidence limit for F: < 0.1
PADUCAH
Upper confidence limit for F: 0.8
Percent exceeding 0.2 µg/m3 (F): 0.1
Lower confidence limit for F: < 0.1
ETTP
Upper confidence limit for F: 0.3
Percent exceeding 0.2 µg/m3 (F): 0.1
Lower confidence limit for F: < 0.1
LLNL
Upper confidence limit for F: 0.2
Percent exceeding 0.2 µg/m3 (F): 0.1
Lower confidence limit for F: 0.1
HAN
Upper confidence limit for F: 0.2
Percent exceeding 0.2 µg/m3 (F): 0.2
Lower confidence limit for F: 0.2
KAPL
Upper confidence limit for F: 27.5
Percent exceeding 0.2 µg/m3 (F): 0.3
Lower confidence limit for F: < 0.1
INL
Upper confidence limit for F: 0.5
Percent exceeding 0.2 µg/m3 (F): 0.4
Lower confidence limit for F: 0.3
NNSS
Upper confidence limit for F: 1.1
Percent exceeding 0.2 µg/m3 (F): 0.7
Lower confidence limit for F: 0.5
SRS
Upper confidence limit for F: 2.1
Percent exceeding 0.2 µg/m3 (F): 1.1
Lower confidence limit for F: 0.5
LANL
Upper confidence limit for F: 1.1
Percent exceeding 0.2 µg/m3 (F): 1.1
Lower confidence limit for F: 1.0
Y-12 NRE
Upper confidence limit for F: 2.7
Percent exceeding 0.2 µg/m3 (F): 1.4
Lower confidence limit for F: 0.6
Y-12
Upper confidence limit for F: 1.7
Percent exceeding 0.2 µg/m3 (F): 1.6
Lower confidence limit for F: 1.6
SNL
Upper confidence limit for F: 4.7
Percent exceeding 0.2 µg/m3 (F): 3.8
Lower confidence limit for F: 3.1
ANL
Upper confidence limit for F: 7.0
Percent exceeding 0.2 µg/m3 (F): 4.1
Lower confidence limit for F: 2.3
PTX
Upper confidence limit for F: 5.0
Percent exceeding 0.2 µg/m3 (F): 4.4
Lower confidence limit for F: 3.9
-
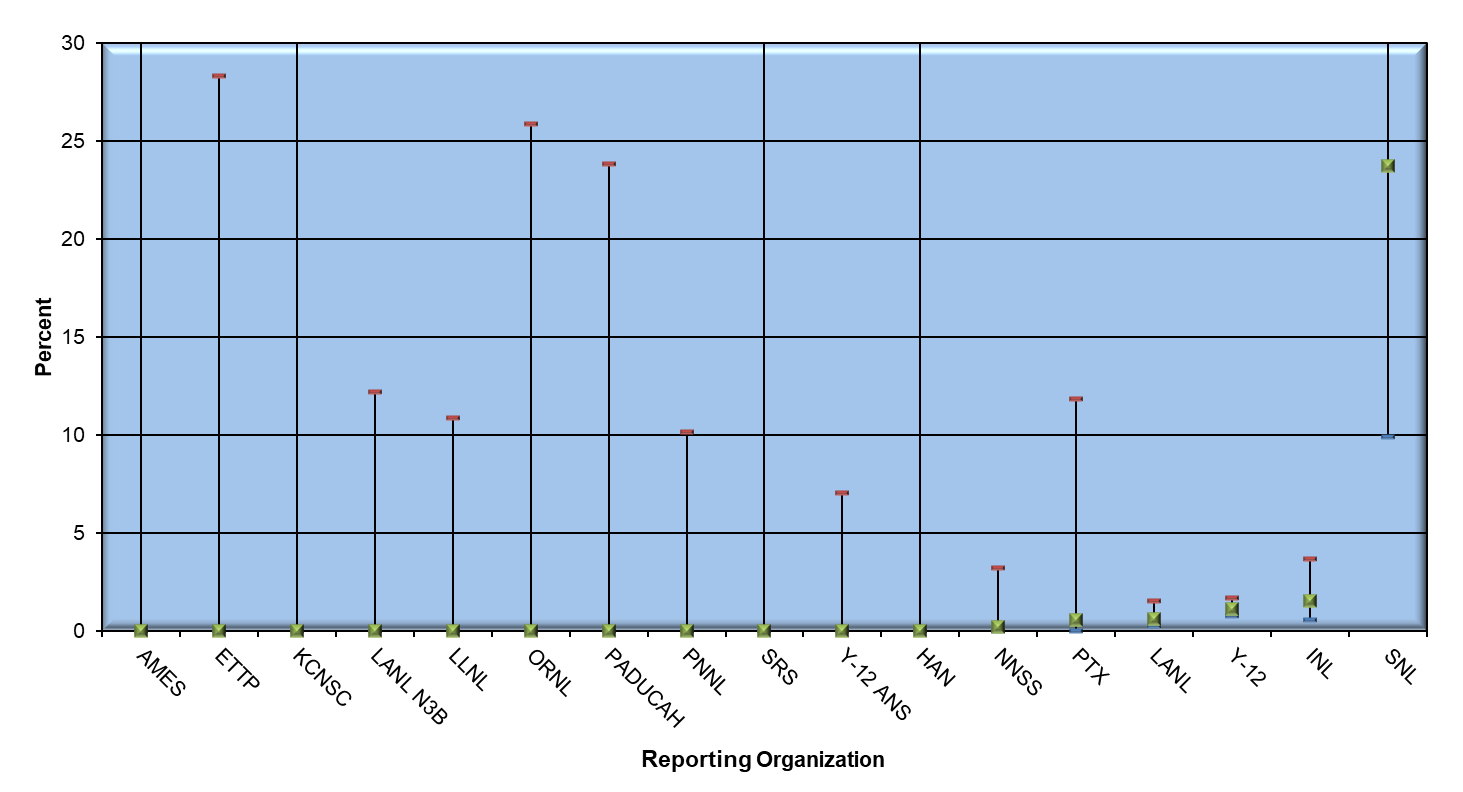
Exposure Monitoring Results Exceeding Action Level 0.2 µg/m3 by Reporting Organization (2019)*
Mouse over or click a data point to view additional information.
Percent exceeding 0.2 μg/m3 based on 95% Confidence Limits
This graphic provides the percent of exposure monitoring results that exceeded the action level by reporting organization for CY2019. The upper confidence limit is above 5% at organizations that reported 62 or fewer sampling results in 2019 or reported similar time weighted average values for detects and non-detects. Fewer organizations reported exposure monitoring in recent years, and those organizations submitting data have also reported fewer sampling results. This downward trend impacts the analysis and interpretation of results in the BAWR. The small sample size reduces accuracy and causes higher variability in the statistical models used. Certainly, the wide confidence intervals in the single year 2019 analysis demonstrate the reduction of statistical power and confidence in the interpretation when compared to similar but larger samples of the population.
Historically, this graph excluded results for reporting organizations with small numbers of total samples. This figure instead includes data for all 17 organizations since all but 5 organizations reported 62 or fewer results for CY2019.
The table below gives additional summary statistics for organizations reporting exposure data to the BAWR during 2019. Organizations that did not report data for calendar year 2019 are not included in this table.
The data in the graphic and table show that Sandia National Laboratory had the greatest percentage (23.7%) of reported exposure monitoring results exceeding the action level in CY2019.
Summary Statistics for Exposure Monitoring Results Exceeding Action Level 0.2 μg/m3 by Reporting Organization (2019)* Reporting Organization No. monitoring results No. detected values % non-detects No. individ. monitored Obs. 95th percentile (ug/m3) 95% UTL /95th% (ug/m3) Largest value (ug/m3) % > 0.2 ug/m3 (F) Lower confidence limit for F Upper confidence limit for F AMES 8 (0.3%) 3 (1.9%) 62.5 5 (1.6%) < 0.001 NA < 0.001 0 0 91.1 ETTP 9 (0.4%) 0 (0%) 100 8 (2.6%) 0.01 NA 0.01 0 0 28.3 HAN 798 (31.4%) 2 (1.3%) 99.7 2 (0.7%) 0.001 0.025 0.052 < 0.1 0 98.4 INL 94 (3.7%) 46 (29.3%) 51.1 10 (3.3%) 0.112 0.195 0.326 1.5 0.5 3.7 KCNSC 2 (0.1%) 0 (0%) 100 16 (5.2%) 0.022 NA 0.022 0 0 77.6 LANL 240 (9.4%) 29 (18.5%) 87.9 10 (3.3%) 0.011 0.041 0.614 0.6 0.2 1.5 LANL N3B 23 (0.9%) 1 (0.6%) 95.7 5 (1.6%) 0.005 NA 0.015 0 0 12.2 LLNL 26 (1%) 0 (0%) 100 9 (3%) 0.018 NA 0.035 0 0 10.9 NNSS 21 (0.8%) 13 (8.3%) 38.1 3 (1%) 0.024 NA 0.06 0.2 < 0.1 3.2 ORNL 10 (0.4%) 0 (0%) 100 14 (4.6%) 0.009 NA 0.01 0 0 25.9 PADUCAH 11 (0.4%) 0 (0%) 100 5 (1.6%) < 0.001 NA < 0.001 0 0 23.8 PNNL 28 (1.1%) 0 (0%) 100 9 (3%) 0.005 NA 0.005 0 0 10.1 PTX 67 (2.6%) 3 (1.9%) 96 27 (8.9%) 0.002 0.151 0.151 0.5 < 0.1 11.8 SNL 14 (0.6%) 8 (5.1%) 42.9 9 (3%) 1.755 NA 3.82 23.7 9.9 44.4 SRS 4 (0.2%) 0 (0%) 100 3 (1%) 0.004 NA 0.004 0 0 52.7 Y-12 1,147 (45.1%) 52 (33.1%) 95.5 156 (51.1%) 0.001 0.017 23.084 1.1 0.8 1.7 Y-12 ANS 41 (1.6%) 0 (0%) 100 14 (4.6%) 0.009 NA 0.009 0 0 7 All 2,543 (100%) 157 (100%) 93.8 305 (100%) 0.011 0.026 23.084 1.0 0.7 1.3 AMES
Upper confidence limit for F: 91.1
Percent exceeding 0.2 µg/m3 (F): 0
Lower confidence limit for F: 0
ETTP
Upper confidence limit for F: 28.3
Percent exceeding 0.2 µg/m3 (F): 0
Lower confidence limit for F: 0
KCNSC
Upper confidence limit for F: 77.6
Percent exceeding 0.2 µg/m3 (F): 0
Lower confidence limit for F: 0
LANL N3B
Upper confidence limit for F: 12.2
Percent exceeding 0.2 µg/m3 (F): 0
Lower confidence limit for F: 0
LLNL
Upper confidence limit for F: 10.9
Percent exceeding 0.2 µg/m3 (F): 0
Lower confidence limit for F: 0
ORNL
Upper confidence limit for F: 25.9
Percent exceeding 0.2 µg/m3 (F): 0
Lower confidence limit for F: 0
PADUCAH
Upper confidence limit for F: 23.8
Percent exceeding 0.2 µg/m3 (F): 0
Lower confidence limit for F: 0
PNNL
Upper confidence limit for F: 10.1
Percent exceeding 0.2 µg/m3 (F): 0
Lower confidence limit for F: 0
SRS
Upper confidence limit for F: 52.7
Percent exceeding 0.2 µg/m3 (F): 0
Lower confidence limit for F: 0
Y-12 ANS
Upper confidence limit for F: 7.0
Percent exceeding 0.2 µg/m3 (F): 0
Lower confidence limit for F: 0
HAN
Upper confidence limit for F: 98.4
Percent exceeding 0.2 µg/m3 (F): < 0.1
Lower confidence limit for F: 0
NNSS
Upper confidence limit for F: 3.2
Percent exceeding 0.2 µg/m3 (F): 0.2
Lower confidence limit for F: < 0.1
PTX
Upper confidence limit for F: 11.8
Percent exceeding 0.2 µg/m3 (F): 0.5
Lower confidence limit for F: < 0.1
LANL
Upper confidence limit for F: 1.5
Percent exceeding 0.2 µg/m3 (F): 0.6
Lower confidence limit for F: 0.2
Y-12
Upper confidence limit for F: 1.7
Percent exceeding 0.2 µg/m3(F): 1.1
Lower confidence limit for F: 0.8
INL
Upper confidence limit for F: 3.7
Percent exceeding 0.2 µg/m3 (F): 1.5
Lower confidence limit for F: 0.5
SNL
Upper confidence limit for F: 44.4
Percent exceeding 0.2 µg/m3 (F): 23.7
Lower confidence limit for F: 9.9
-
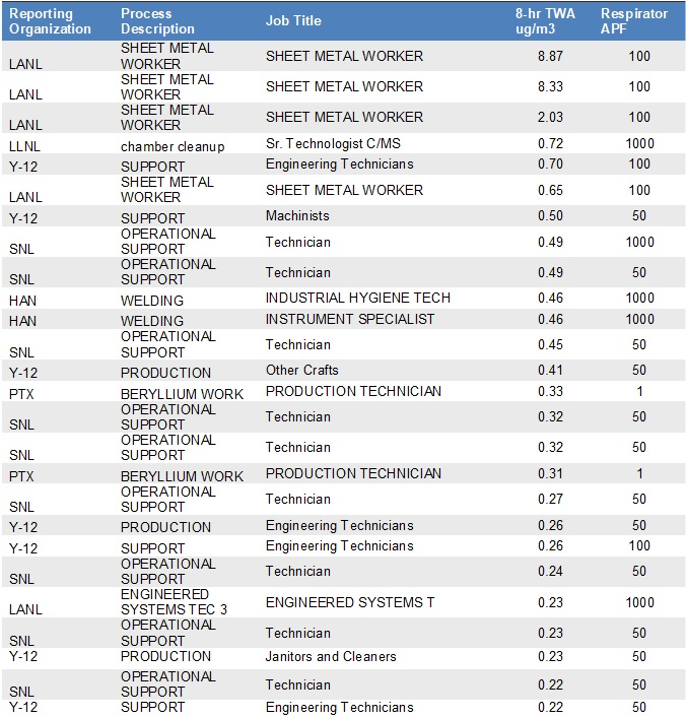
Exposure Monitoring Results Exceeding Action Level 0.2 µg/m3 by Reporting Organization (2019)
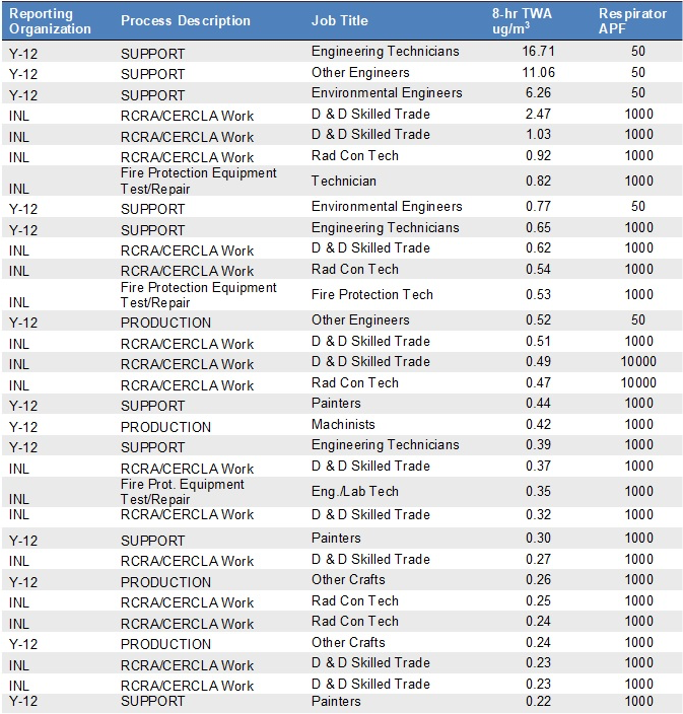
This table provides the reporting organization, process description, 8-hour TWA, and the respirator assigned protection factor (APF) for the results observed above the action level through 2019.
Exceedances for 2019 were less than in 2018 with twenty-one (21) samples exceeding the action level in 2019, compared with 31 in 2018, and 36 in 2017. Since the total reported exposure sampling results continue to decrease over time, the proportion of exceedances is greater than in previous years. In all cases work planning processes identified the potential for beryllium exposure and workers wore appropriate respiratory protection.
Reporting Organization Process Description Job Title 8-hr TWA ug/m3 Respirator APF Y-12 SUPPORT Engineering Technicians 16.71 50 Y-12 SUPPORT Other Engineers 11.06 50 Y-12 SUPPORT Environmental Engineers 6.26 50 INL RCRA/CERCLA Work D & D Skilled Trade 2.47 1000 INL RCRA/CERCLA Work D & D Skilled Trade 1.03 1000 INL RCRA/CERCLA Work Rad Con Tech 0.92 1000 INL Fire Protection Equipment Test/Repair Technician 0.82 1000 Y-12 SUPPORT Environmental Engineers 0.77 50 Y-12 SUPPORT Engineering Technicians 0.65 1000 INL RCRA/CERCLA Work D & D Skilled Trade 0.62 1000 INL RCRA/CERCLA Work Rad Con Tech 0.54 1000 INL Fire Protection Equipment Test/Repair Fire Protection Tech 0.53 1000 Y-12 PRODUCTION Other Engineers 0.52 50 INL RCRA/CERCLA Work D & D Skilled Trade 0.51 1000 INL RCRA/CERCLA Work D & D Skilled Trade 0.49 10000 INL RCRA/CERCLA Work Rad Con Tech 0.47 10000 Y-12 SUPPORT Painters 0.44 1000 Y-12 PRODUCTION Machinists 0.42 1000 Y-12 SUPPORT Engineering Technicians 0.39 1000 INL RCRA/CERCLA Work D & D Skilled Trade 0.37 1000 INL Fire Prot. Equipment Test/Repair Eng./Lab Tech 0.35 1000 INL RCRA/CERCLA Work D & D Skilled Trade 0.32 1000 Y-12 SUPPORT Painters 0.30 1000 INL RCRA/CERCLA Work D & D Skilled Trade 0.27 1000 Y-12 PRODUCTION Other Crafts 0.26 1000 INL RCRA/CERCLA Work Rad Con Tech 0.25 1000 INL RCRA/CERCLA Work Rad Con Tech 0.24 1000 Y-12 PRODUCTION Other Crafts 0.24 1000 INL RCRA/CERCLA Work D & D Skilled Trade 0.23 1000 INL RCRA/CERCLA Work D & D Skilled Trade 0.23 1000 Y-12 SUPPORT Painters 0.22 1000 -
Exposure Monitoring Results Exceeding Action Level 0.2 µg/m3 by Reporting Organization (2018)
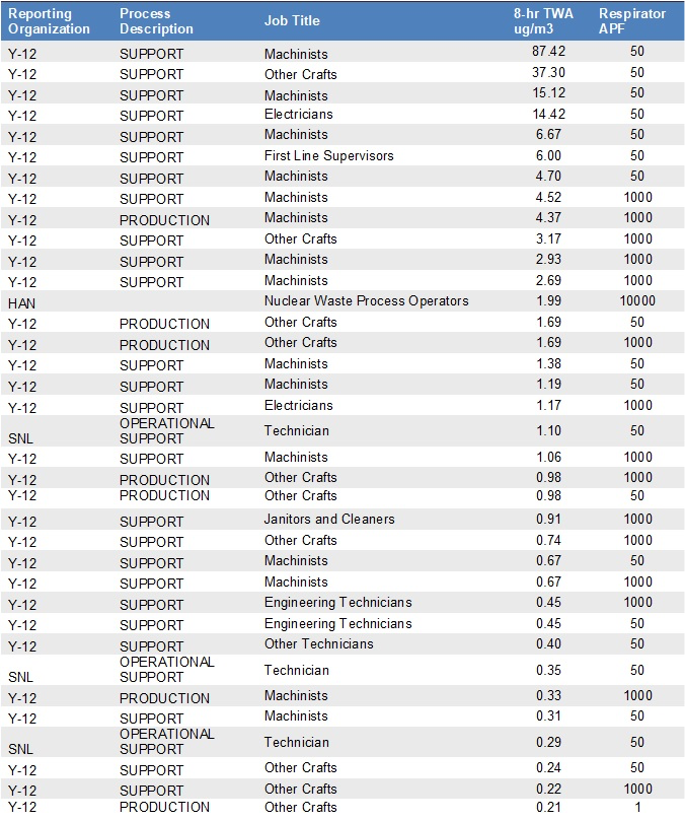
This table provides the reporting organization, process description, 8-hour TWA, and the respirator assigned protection factor (APF) for the results observed above the action level through 2018.
Exceedances for 2018 were less than in 2017, but greater than in any other years since 2012. Thirty-one (31) samples exceeded the action level in 2018, compared with 36 in 2017, and 26 in 2016. Since the total reported exposure sampling results continue to decrease over time, the proportion of exceedances is greater than in previous years. Exceedances in 2018 were associated with RCRA and fire equipment maintenance at INL and support, and production activities at Y-12. In all but a few cases, work planning processes identified the potential for beryllium exposure and workers wore appropriate respiratory protection.
Reporting Organization Process Description Job Title 8-hr TWA ug/m3 Respirator APF Y-12 SUPPORT Machinists 87.42 50 Y-12 SUPPORT Other Crafts 37.30 50 Y-12 SUPPORT Machinists 15.12 50 Y-12 SUPPORT Electricians 14.42 50 Y-12 SUPPORT Machinists 6.67 50 Y-12 SUPPORT First Line Supervisors 6.00 50 Y-12 SUPPORT Machinists 4.70 50 Y-12 SUPPORT Machinists 4.52 1000 Y-12 PRODUCTION Machinists 4.37 1000 Y-12 SUPPORT Other Crafts 3.17 1000 Y-12 SUPPORT Machinists 2.93 1000 Y-12 SUPPORT Machinists 2.69 1000 HAN Nuclear Waste Process Operators 1.99 10000 Y-12 PRODUCTION Other Crafts 1.69 50 Y-12 PRODUCTION Other Crafts 1.69 1000 Y-12 SUPPORT Machinists 1.38 50 Y-12 SUPPORT Machinists 1.19 50 Y-12 SUPPORT Electricians 1.17 1000 SNL OPERATIONAL SUPPORT Technician 1.10 50 Y-12 SUPPORT Machinists 1.06 1000 Y-12 PRODUCTION Other Crafts 0.98 1000 Y-12 PRODUCTION Other Crafts 0.98 50 Y-12 SUPPORT Janitors and Cleaners 0.91 1000 Y-12 SUPPORT Other Crafts 0.74 1000 Y-12 SUPPORT Machinists 0.67 50 Y-12 SUPPORT Machinists 0.67 1000 Y-12 SUPPORT Engineering Technicians 0.45 1000 Y-12 SUPPORT Engineering Technicians 0.45 50 Y-12 SUPPORT Other Technicians 0.40 50 SNL OPERATIONAL SUPPORT Technician 0.35 50 Y-12 PRODUCTION Machinists 0.33 1000 Y-12 SUPPORT Machinists 0.31 50 SNL OPERATIONAL SUPPORT Technician 0.29 50 Y-12 SUPPORT Other Crafts 0.24 50 Y-12 SUPPORT Other Crafts 0.22 1000 Y-12 PRODUCTION Other Crafts 0.21 1 -
Exposure Monitoring Results Exceeding Action Level 0.2 µg/m3 by Reporting Organization (2017)
This table provides the reporting organization, process description, 8-hour TWA, and the respirator assigned protection factor (APF) for the results observed above the action level through 2017.
Exceedances in 2017 were primarily associated with support activities at Y-12 and SNL.
Reporting Organization Process Description Job Title 8-hr TWA ug/m3 Respirator APF Y-12 SUPPORT Machinists 87.42 50 Y-12 SUPPORT Other Crafts 37.3 50 Y-12 SUPPORT Machinists 15.12 50 Y-12 SUPPORT Electricians 14.42 50 Y-12 SUPPORT Machinists 6.67 50 Y-12 SUPPORT First Line Supervisors 6 50 Y-12 SUPPORT Machinists 4.7 50 Y-12 SUPPORT Machinists 4.52 1000 Y-12 PRODUCTION Machinists 4.37 1000 Y-12 SUPPORT Other Crafts 3.17 1000 Y-12 SUPPORT Machinists 2.93 1000 Y-12 SUPPORT Machinists 2.69 1000 HAN Nuclear Waste Process Operators 1.99 10000 Y-12 PRODUCTION Other Crafts 1.69 50 Y-12 PRODUCTION Other Crafts 1.69 1000 Y-12 SUPPORT Machinists 1.38 50 Y-12 SUPPORT Machinists 1.19 50 Y-12 SUPPORT Electricians 1.17 1000 SNL OPERATIONAL SUPPORT Technician 1.1 50 Y-12 SUPPORT Machinists 1.06 1000 Y-12 PRODUCTION Other Crafts 0.98 1000 Y-12 PRODUCTION Other Crafts 0.98 50 Y-12 SUPPORT Janitors and Cleaners 0.91 1000 Y-12 SUPPORT Other Crafts 0.74 1000 Y-12 SUPPORT Machinists 0.67 50 Y-12 SUPPORT Machinists 0.67 1000 Y-12 SUPPORT Engineering Technicians 0.45 1000 Y-12 SUPPORT Engineering Technicians 0.45 50 Y-12 SUPPORT Other Technicians 0.4 50 SNL OPERATIONAL SUPPORT Technician 0.35 50 Y-12 PRODUCTION Machinists 0.33 1000 Y-12 SUPPORT Machinists 0.31 50 SNL OPERATIONAL SUPPORT Technician 0.29 50 Y-12 SUPPORT Other Crafts 0.24 50 Y-12 SUPPORT Other Crafts 0.22 1000 Y-12 PRODUCTION Other Crafts 0.21 NA
Health and Monitoring Comparisons
Two different reporting organization groups collect the data associated with health monitoring and exposure monitoring. Occupational health and medical groups collect health monitoring data and industrial hygiene groups collect exposure monitoring data. In most cases, a data coordinator collates the data prior to submission to the Registry. In this section, the health screening data compared to the exposure monitoring data provides insight on the effectiveness of coordination between the 2 activities.
-
Comparison of the Number and Percent Proportion for Beryllium-Associated Workers Diagnosed with BeS or CBD with and without Exposure Sampling Results by Reporting Organizations (n=687) (2002-2019)*
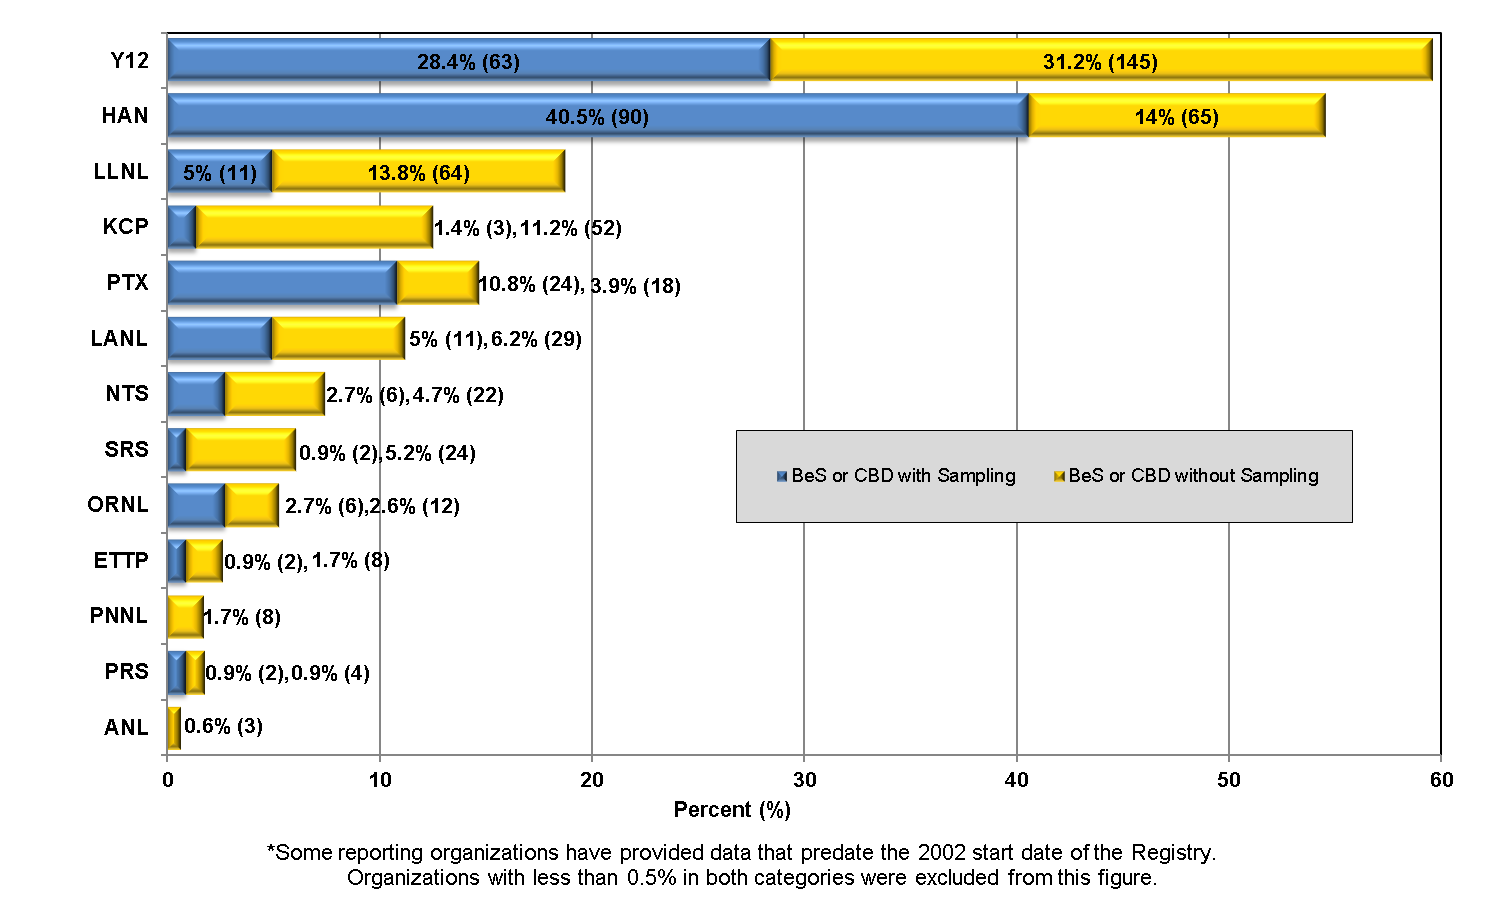
The data in the figure shows the collective number of BeS or CBD individuals through 2019 who have had exposure monitoring results submitted to the Registry. The figure also illustrates the collective number of individuals who have not had exposure data submitted to the Registry. More than two- thirds (465 out of 687, or 68%) of the workers currently identified as BeS or diagnosed with CBD have no exposure sampling data. The proportion reported in the 2018 and 2017 annual summaries were also 68%. The proportion reported in each of the summaries for 2016 through 2013 was 67%.
DOE and ORISE program staff evaluated these data by each mutually exclusive subcategory, BeS or CBD. Of the 532 employees who are sensitized (BeS) and have not progressed to CBD, only 172 (32%) had any exposure sampling measurements submitted to the Registry. Only 109 (21%) of these sensitization cases had any exposure records dated earlier than their reported date of sensitization.
Of the 172 sensitization cases with exposure sampling data, 63 cases only had exposure sampling data with monitoring dates later than their reported date of beryllium sensitization. In other words, 37% of the BeS cases with exposure data had exposure monitoring initiated only after diagnosed as sensitized.
Eighty-eight (88) of the 532 sensitization cases had at least one reported exposure record dated later than their reported date of beryllium sensitization; but this includes the 25 cases that had exposure data both before and after their date of sensitization.
Of the 155 employees reported as diagnosed with CBD, 50 (32%) of the cases had at least one exposure sampling measurement submitted to the Registry. Only 31 (20%) of the total CBD cases had at least one reported exposure record in the Registry dated earlier than their reported date of CBD diagnosis.
In comparison, 31 (21%) CBD cases had at least one reported exposure record dated later than their date of CBD diagnosis. Industrial hygiene programs monitor workers diagnosed with CBD to ensure compliance with restricted duty. Nevertheless, 19 of the CBD cases only had exposure sampling data later than their reported date of CBD diagnosis. Therefore, only 29 of the CBD cases had exposure monitoring records prior to their CBD diagnosis. Most sites will not assign BeS or CBD workers to jobs where there is a risk of beryllium exposure, so no sampling is required.
-
Comparison of the Percent of Workers Diagnosed with BeS or CBD with Percent Exceeding Action Level 0.2 μg/m3 by Reporting Organization (2002-2019).
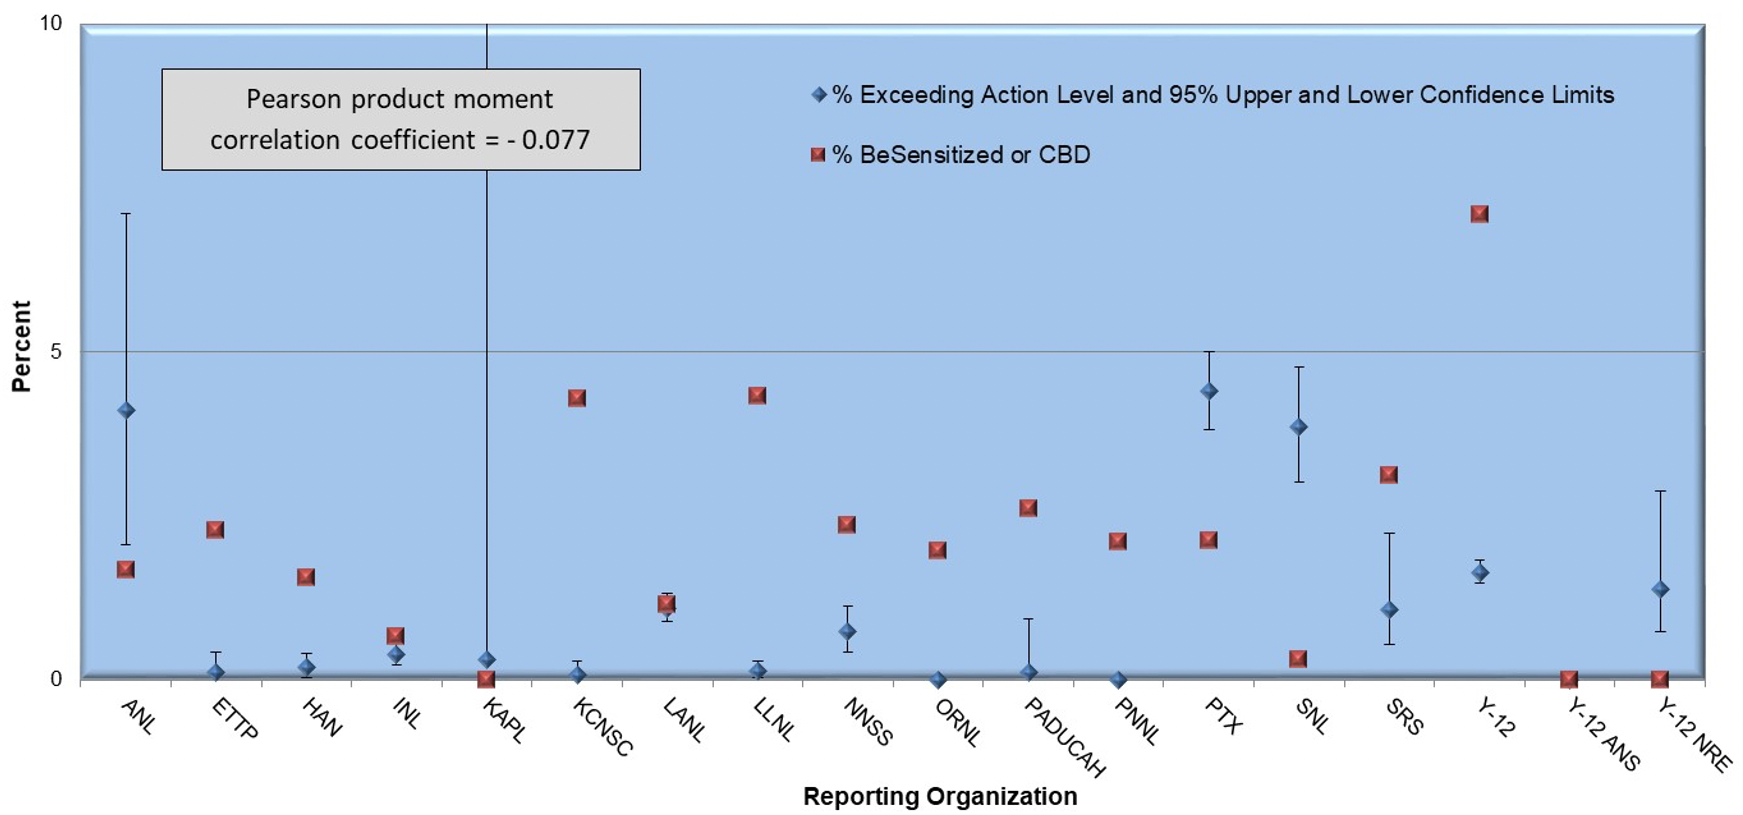
The figure compares the cumulative percent of workers sensitized or CBD to the percent of exposure samples exceeding the 0.2 µg/m3 action level for each reporting agency. These data illustrate that no statistical correlation exists between the incidence of BeS/CBD and the percent of exceedances among the exposure sampling results submitted to the Registry (Pearson product moment correlation coefficient = -0.077). The lack of correlation could be due to sensitization and CBD cases associated with past work locations or conditions rather than the environment currently monitored. However, it is also possible that the exposure monitoring programs are missing sources of exposure. Reporting organizations with low exposure monitoring results and high sensitization or CBD rates should investigate cases to determine if there is a possibility of ongoing exposures.