
Data Metrics & Results
BAWR Reporting Sites and Target Population
Beryllium-Associated Worker Registry (BAWR) includes Reporting Organizations associated with the U.S. Department of Energy (DOE)-operated facilities. It includes DOE contractor and federal workers who:
- Have been exposed, or have had the potential for exposure, to airborne concentrations of beryllium due to their work at the present or a previous DOE site;
- Self-identify and indicate a history of possible exposure; or
- Exhibit symptoms of beryllium exposure or are receiving medical removal protection benefits.
The site’s Chronic Beryllium Disease Prevention Program (CBDPP) may also include other workers in the BAWR reporting for their site, as appropriate. Subcontractors who are not included under the main site’s CBDPP must have their own CBDPP and report data separately. The 10 CFR 850 contains further information on beryllium and beryllium-associated workers, and which organizations should have CBDPPs.
Through the 2025 calendar year, the BAWR received data from the following 30 DOE-affiliated reporting organizations:
- Ames National Laboratory (Ames Lab)
- Argonne National Laboratory (ANL)
- Brookhaven National Laboratory (BNL)
- DOE Oak Ridge Office (DOE-ORO)
- East Tennessee Technology Park (ETTP)
- Fermi National Accelerator Laboratory (Fermi)
- Hanford Site (HAN)
- Idaho National Laboratory (INL)
- Kansas City National Security Campus (KCNSC)
- Knolls Atomic Power Laboratory (KAPL)
- Lawrence Berkeley National Laboratory (LBNL)
- Lawrence Livermore National Laboratory (LLNL)
- LLNL Clean Harbors Environmental Services (LLNL CHES)
- LLNL North Wind (LLNL NW)
- Los Alamos National Laboratory (LANL)
- LANL N3B (LANL N3B)
- Nevada National Security Site (NNSS)
- Oak Ridge National Laboratory (ORNL)
- Pacific Northwest National Laboratory (PNNL)
- PNNL DGR Grand Construction (PNNL DGR)
- PNNL Apollo Mechanical Contractors (PNNL AMC)
- Paducah Site (PADUCAH)
- Pantex Plant (PTX)
- Portsmouth Gaseous Diffusion Plant (PORTS)
- Sandia National Laboratories (SNL)
- Savannah River Site (SRS)
- Simmons and Golden Security, LLC (S&G)
- SLAC National Accelerator Laboratory (SLAC)
- Y-12 Atkins Nuclear Secured (Y-12 ANS)
- Y-12 National Security Complex (Y‑12)
All but one of the 30 active reporting organizations collected health data through the operation of their medical surveillance programs.
Twenty-five (25) organizations conducted exposure sampling through their industrial hygiene programs. Sixteen of these organizations reported exposure sampling in CY2025. Simmons and Golden Security, LLC (S&G) and do not submit exposure sampling data since their workers are in the BAWR due to prior work at another DOE site and have no potential for exposure.
There are 9 reporting organizations that previously participated in the program, but due to contract changes or work completion, no longer submit data. The previously submitted data from these organizations, referred to as inactive reporting organizations, remain in the BAWR. Years in parentheses are the years the organization actively reported to BAWR.
The inactive reporting organizations are:
- Advanced Mixed Waste Treatment Project (AMWTP) (2005-2016)
- LLNL Boston University (LLNL BU) (2008-2009)
- LLNL Envirocon, Inc. (LLNL ENVC) (2010-2012)
- National Strategic Protective Services, LLC for ETTP and ORNL (NSPS) (2008-2018)
- Rocky Flats Closure Project (RF) (1984-2005)
- Southwestern Power Administration (SWPA) (2002)
- Wackenhut Security Services, Inc. for ETTP, ORNL, and Y-12 (WSI) (2002-2012)
- Y-12 Navarro Research and Engineering (Y-12 NRE) (2007-2014)
- Y-12 URS Corporation (Y-12 URS) (2008-2014)
-
Geographical Locations for 30 Active BAWR Reporting Organizations (2025)
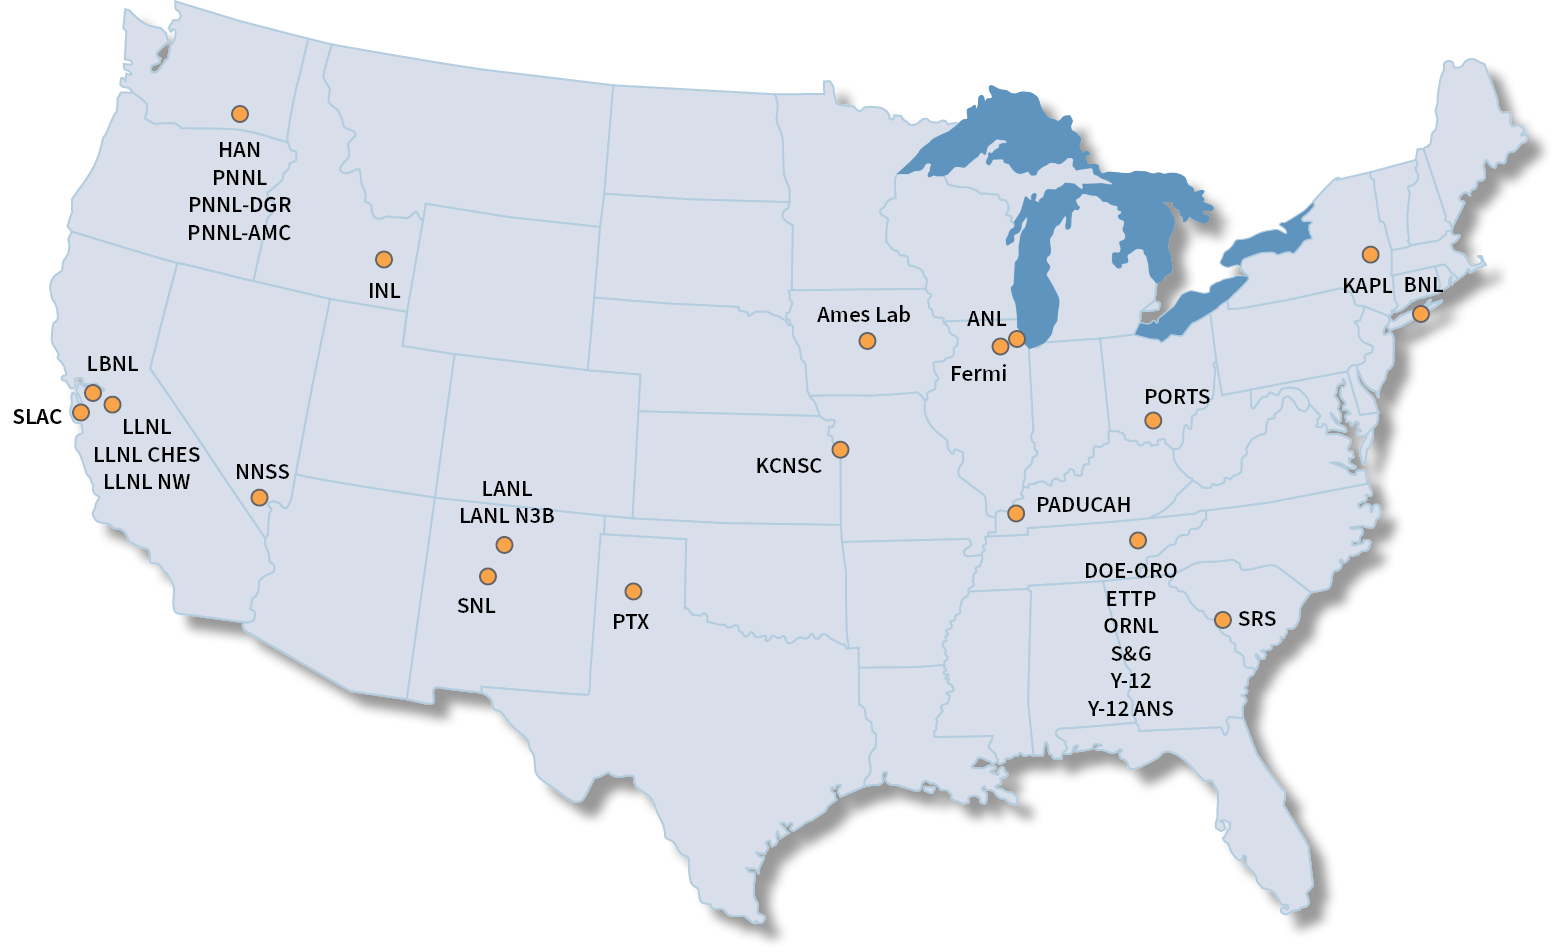
Select a location indicator (blue circle) to see additional information for the specific reporting organization.
Click here for List of Acronyms
This map shows the geographical locations of the 30 DOE-affiliated actively reporting organizations.
Ames National Laboratory (Ames Lab)
Number of Workers: Roster BeLPT Tested Be Sensitized CBD Exposure Monitored 63 63 2 0 12 Argonne National Laboratory (ANL)
Number of Workers: Roster BeLPT Tested Be Sensitized CBD Exposure Monitored 439 207 3 0 23 Brookhaven National Laboratory (BNL)
Number of Workers: Roster BeLPT Tested Be Sensitized CBD Exposure Monitored 86 57 1 0 51 Fermi National Accelerator Laboratory (Fermi)
Number of Workers: Roster BeLPT Tested Be Sensitized CBD Exposure Monitored 29 21 0 0 23 Richland Area Reporting Locations
Hanford Site (HAN)
Number of Workers: Roster BeLPT Tested Be Sensitized CBD Exposure Monitored 26,814 16,409 125 34 2,738 Pacific Northwest National Laboratory (PNNL)
Number of Workers: Roster BeLPT Tested Be Sensitized CBD Exposure Monitored 571 517 10 0 70 PNNL DGR Grand Construction (PNNL DGR)
Number of Workers: Roster BeLPT Tested Be Sensitized CBD Exposure Monitored 3 3 0 0 3 PNNL Apollo Mechanical Contractors (PNNL AMC)
Number of Workers: Roster BeLPT Tested Be Sensitized CBD Exposure Monitored 6 6 0 0 6 Idaho National Laboratory (INL)
Number of Workers: Roster BeLPT Tested Be Sensitized CBD Exposure Monitored 1,589 546 3 0 430 Knolls Atomic Power Laboratory (KAPL)
Number of Workers: Roster BeLPT Tested Be Sensitized CBD Exposure Monitored 87 45 0 0 39 Los Alamos Area Reporting Locations
Los Alamos National Laboratory (LANL)
Number of Workers: Roster BeLPT Tested Be Sensitized CBD Exposure Monitored 6,953 5,450 39 8 1,085 LANL N3B Project (LANL N3B)
Number of Workers: Roster BeLPT Tested Be Sensitized CBD Exposure Monitored 299 244 1 0 23 Lawrence Berkeley National Laboratory (LBNL)
Number of Workers: Roster BeLPT Tested Be Sensitized CBD Exposure Monitored 39 26 2 0 8 Livermore Area Reporting Locations
Lawrence Livermore National Laboratory (LLNL)
Number of Workers: Roster BeLPT Tested Be Sensitized CBD Exposure Monitored 3,264 2,132 73 4 343 LLNL Clean Harbors Environmental Services (LLNL CHES)
Number of Workers: Roster BeLPT Tested Be Sensitized CBD Exposure Monitored 49 37 0 0 1 LLNL North Wind (LLNL NW)
Number of Workers: Roster BeLPT Tested Be Sensitized CBD Exposure Monitored 65 55 0 0 1 Kansas City National Security Campus (KCNSC)
Number of Workers: Roster BeLPT Tested Be Sensitized CBD Exposure Monitored 1,457 1,338 41 14 206 Nevada National Security Site (NNSS)
Number of Workers: Roster BeLPT Tested Be Sensitized CBD Exposure Monitored 1,538 1,393 23 6 329 Oak Ridge Area Reporting Locations
DOE Oak Ridge Office (DOE-ORO)
Number of Workers: Roster BeLPT Tested Be Sensitized CBD Exposure Monitored 109 108 1 0 2 Simmons and Golden Security, LLC (S&G)
Number of Workers: Roster BeLPT Tested Be Sensitized CBD Exposure Monitored 7 6 1 0 0 East Tennessee Technology Park (ETTP)
Number of Workers: Roster BeLPT Tested Be Sensitized CBD Exposure Monitored 1,824 1,555 7 4 693 Oak Ridge National Laboratory (ORNL)
Number of Workers: Roster BeLPT Tested Be Sensitized CBD Exposure Monitored 1,493 1,521 21 0 350 Y-12 National Security Complex (Y-12)
Number of Workers: Roster BeLPT Tested Be Sensitized CBD Exposure Monitored 5,381 4,689 146 63 1,963 Y-12 Atkins Nuclear Secured (Y-12 ANS)
Number of Workers: Roster BeLPT Tested Be Sensitized CBD Exposure Monitored 65 64 0 0 33 Paducah Site (PADUCAH)
Number of Workers: Roster BeLPT Tested Be Sensitized CBD Exposure Monitored 383 308 6 0 104 Pantex Plant (PTX)
Number of Workers: Roster BeLPT Tested Be Sensitized CBD Exposure Monitored 2,825 2,314 27 15 690 Portsmouth Gaseous Diffusion Plant (PORTS)
Number of Workers: Roster BeLPT Tested Be Sensitized CBD Exposure Monitored 15 13 4 0 2 Sandia National Laboratories (SNL)
Number of Workers: Roster BeLPT Tested Be Sensitized CBD Exposure Monitored 718 690 1 1 183 Savannah River Site (SRS)
Number of Workers: Roster BeLPT Tested Be Sensitized CBD Exposure Monitored 2,294 1,284 24 7 222 SLAC National Accelerator Laboratory (SLAC)
Number of Workers: Roster BeLPT Tested Be Sensitized CBD Exposure Monitored 99 57 0 1 26 -
Data Coordinator Changes by Reporting Organization (2018-2025)
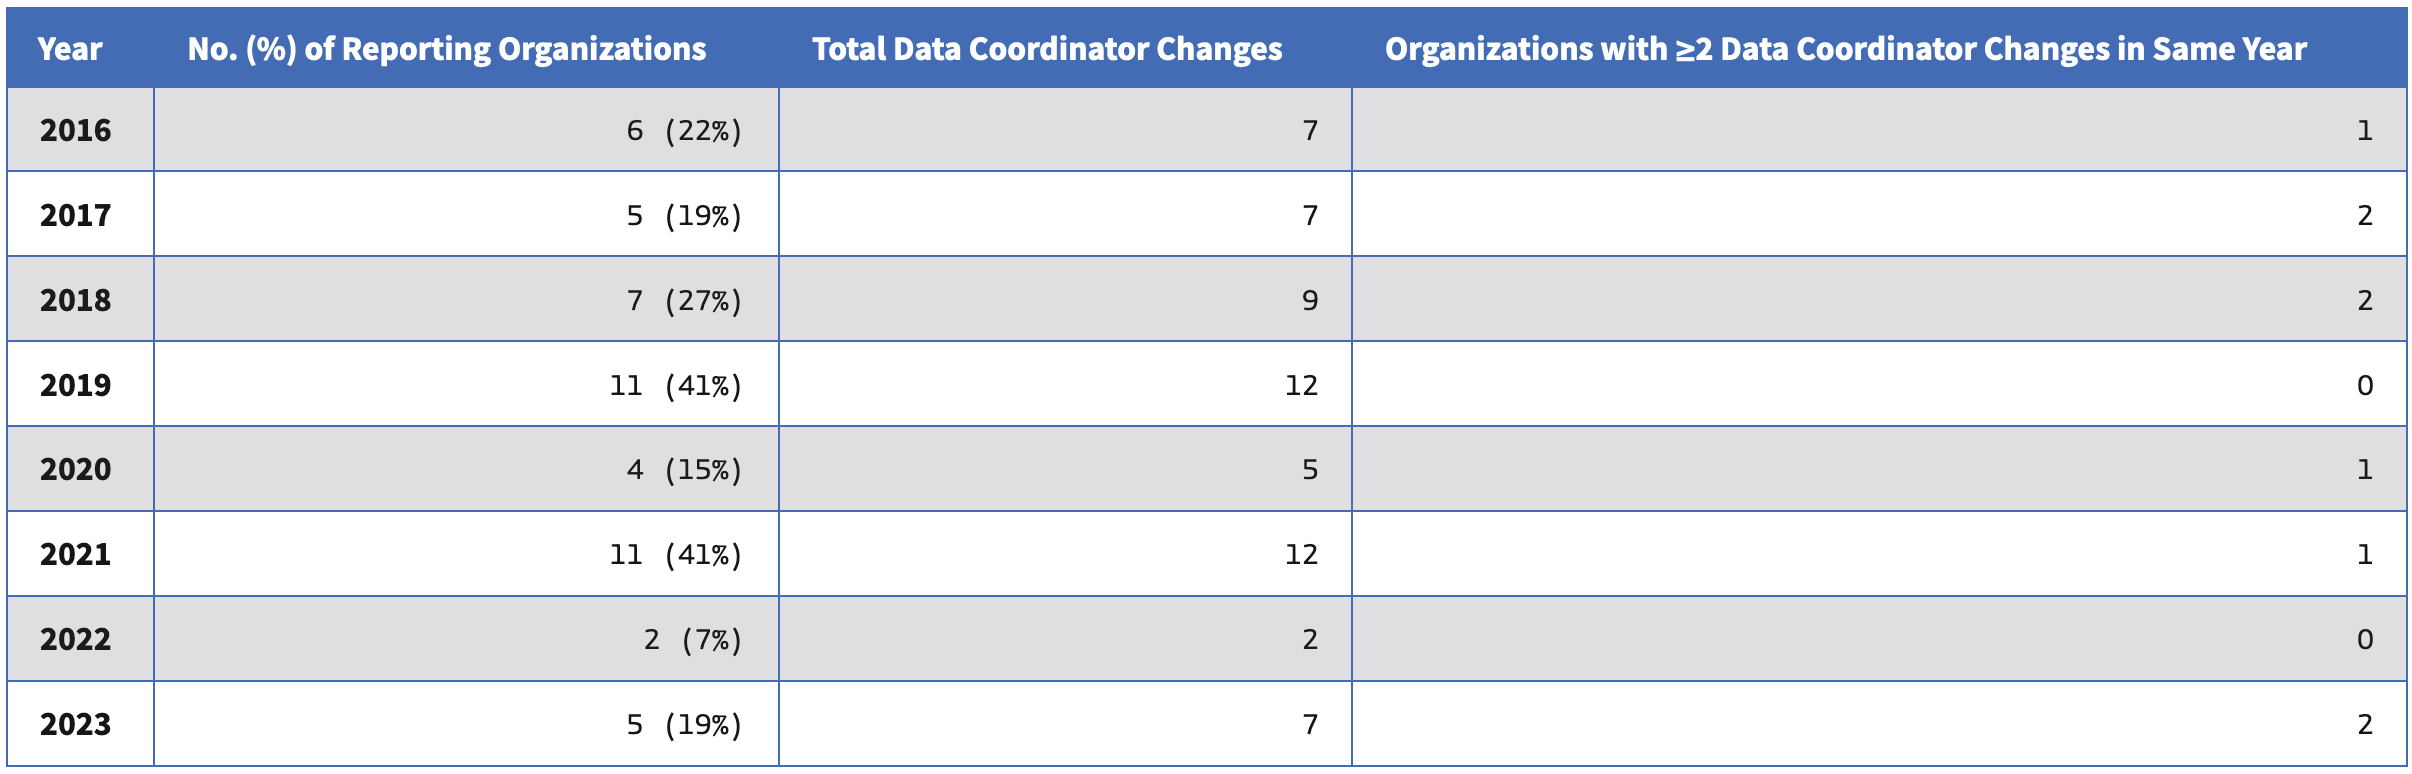
Each reporting organization designates a data coordinator who is responsible for coordinating activities at the site related to data collection, timely submittal of data, and responding to inquiries from the U.S. Department of Energy (DOE) Program Manager and the Oak Ridge Institute for Science and Education Data Center as outlined in the DOE technical standard, DOE-STD-1187-2019. The following table shows that there were 7 data coordinator changes in Calendar Year 2025.
Year No. (%) of Reporting Organizations Total Data Coordinator Changes Organizations with ≥2 Data Coordinator Changes in Same Year 2016 6 (22%) 7 1 2017 5 (19%) 7 2 2018 7 (27%) 9 2 2019 11 (41%) 12 0 2020 4 (15%) 5 1 2021 11 (41%) 12 1 2022 2 (7%) 2 0 2023 5 (19%) 7 2 2024 5 (17%) 6 1 2025 7 (24%) 7 0 Changes in data coordinators often result in the need for additional training and subsequent delays in data submissions. Therefore, significant data coordinator turnover can impact the timely acquisition of data and subsequent reporting of results.
-
Workers reported to the BAWR by Reporting Organization (2002-2025) *
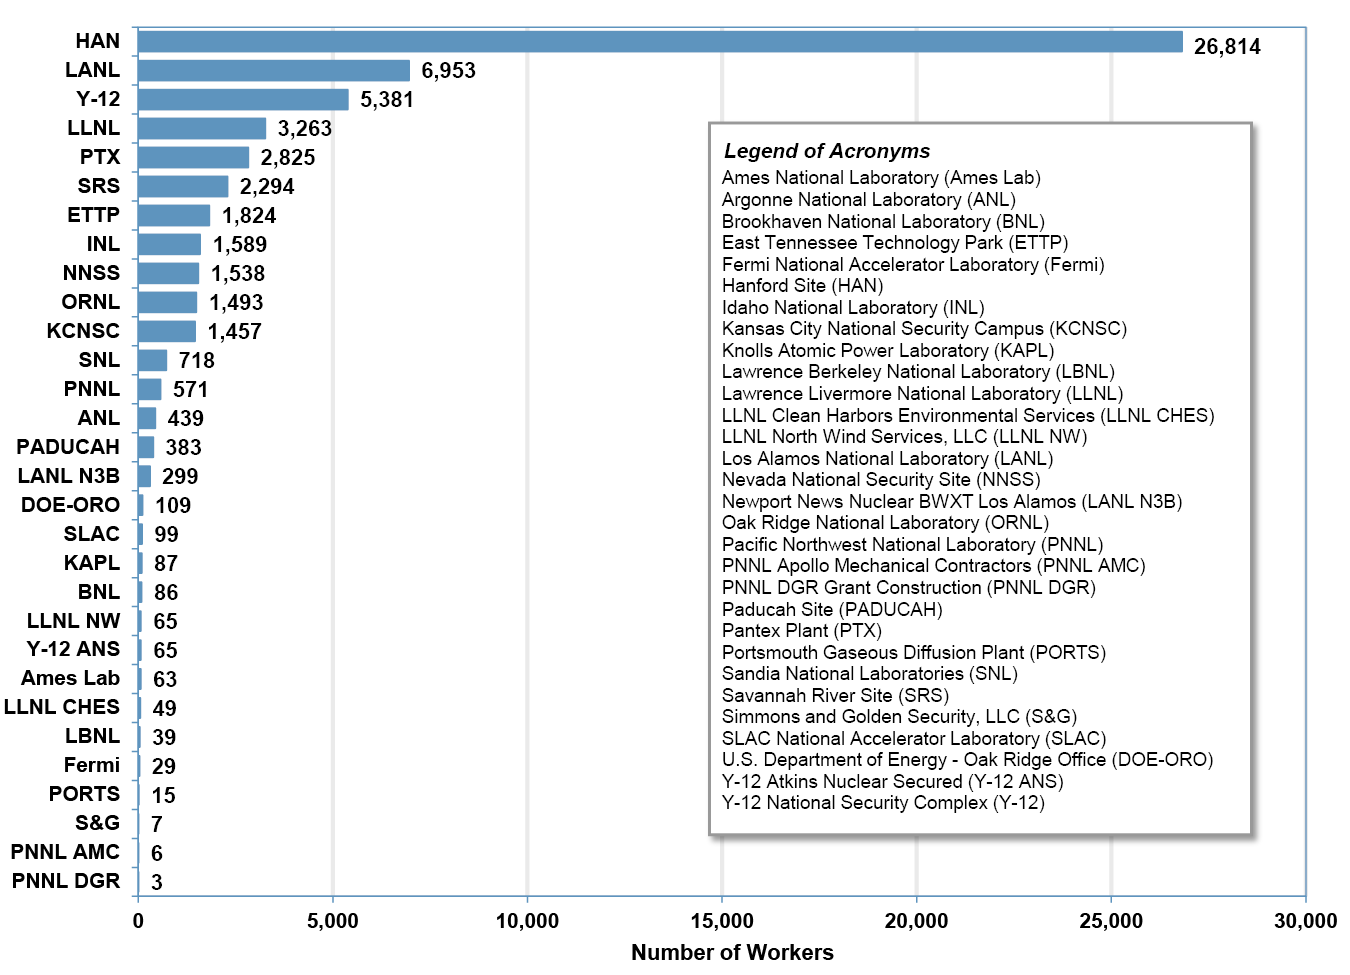
This figure shows the cumulative numbers of beryllium-associated workers reported to the Beryllium-Associated Worker Registry (BAWR) by reporting organization. Through Calendar Year 2025 (CY2025), there were 56,563 workers in the cumulative roster as compared to 56,779 workers in the cumulative roster through CY2024, for an increase of 1,784 workers. Hanford Site has 26,814 workers in the roster, constituting the largest number in the cumulative active roster.
*Some reporting organizations have provided data that predate the 2002 start date of the Registry.
-
Gender and Age Distribution for Workers (2002-2025) *
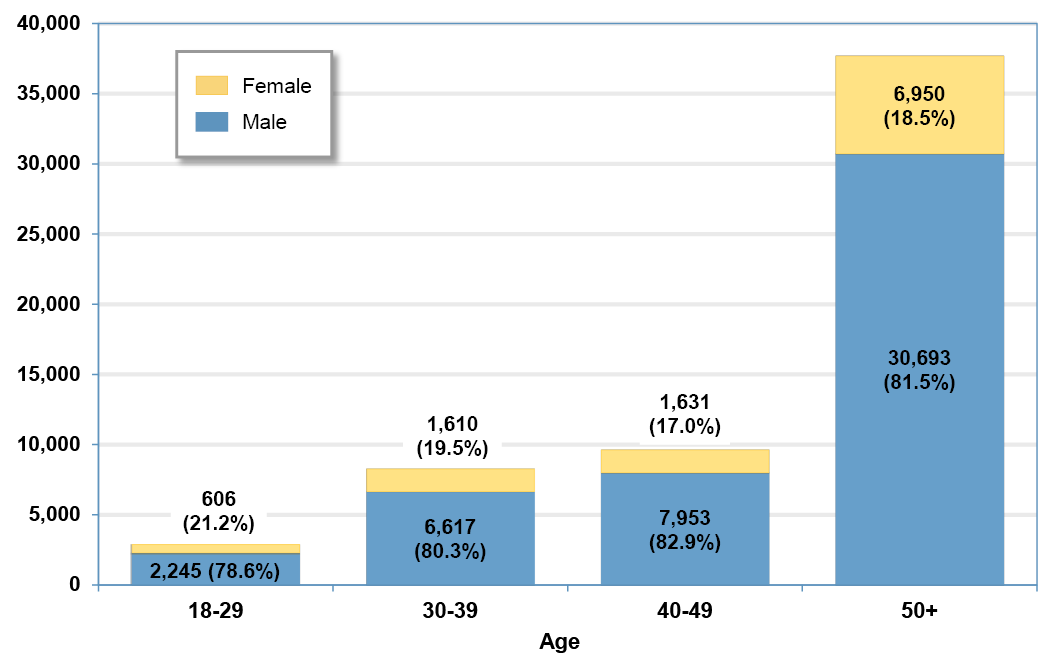
Workers are predominantly male (approximately 81%) and greater than 50 years old (52%). This chart excludes 258 workers (< 0.1%) for whom demographic data were not available.
*Some reporting organizations have provided data that predate the 2002 start date of the Registry.
Health Monitoring Results
Sites’ health clinics collect medical surveillance data on workers identified by their beryllium rosters. These data sets contain beryllium-related health monitoring information and the results of any specialized medical testing. The Site Occupational Medical Director determines the content and frequency of surveillance evaluations and tests based on policies, standards, and the worker’s health and work history. The most vital information collected and reported on an annual basis are the number of workers monitored for beryllium sensitization (BeS) using the beryllium lymphocyte proliferation test (BeLPT), the number of new BeS cases identified, and the number of new cases of chronic beryllium disease (CBD).
Some workers in the roster may decline testing for sensitization. As a result, no records will be available for individuals who refuse this diagnostic evaluation. Some workers may have testing done independently (for example, as part of a former worker program), and in these cases results may be unavailable for Registry reporting unless the worker releases their evaluation report, and it becomes part of the organization’s electronic medical records. Also, advanced medical testing results when workers are referred (after findings suggestive of possible CBD) to a pulmonary medicine or other specialized clinic for follow-up diagnosis and care may not be reported and/or can be difficult to collect.
Sensitization and CBD Screening
The cumulative number of workers with BeLPT screening results submitted to the Beryllium-Associated Worker Registry (BAWR) through Calendar Year 2025 (CY2025) was 41,158. This corresponds to an additional 926 workers tested when compared with the 40,232 workers screened through CY2024.
There was a total of 561 sensitized workers (including 5 new sensitized workers) included in the BAWR, and medical staff diagnosed 157 workers as having CBD through CY2025. BeS and CBD are mutually exclusive categories, (i.e., if a person who is BeS receives a CBD diagnosis, the person’s diagnosis moves to the CBD category and is no longer counted in the BeS category).
-
Number and Proportion of Workers undergoing BeLPT Testing and Diagnosed with BeS or Diagnosed with CBD by Reporting Organization (n=41,158) (2002–2025) *
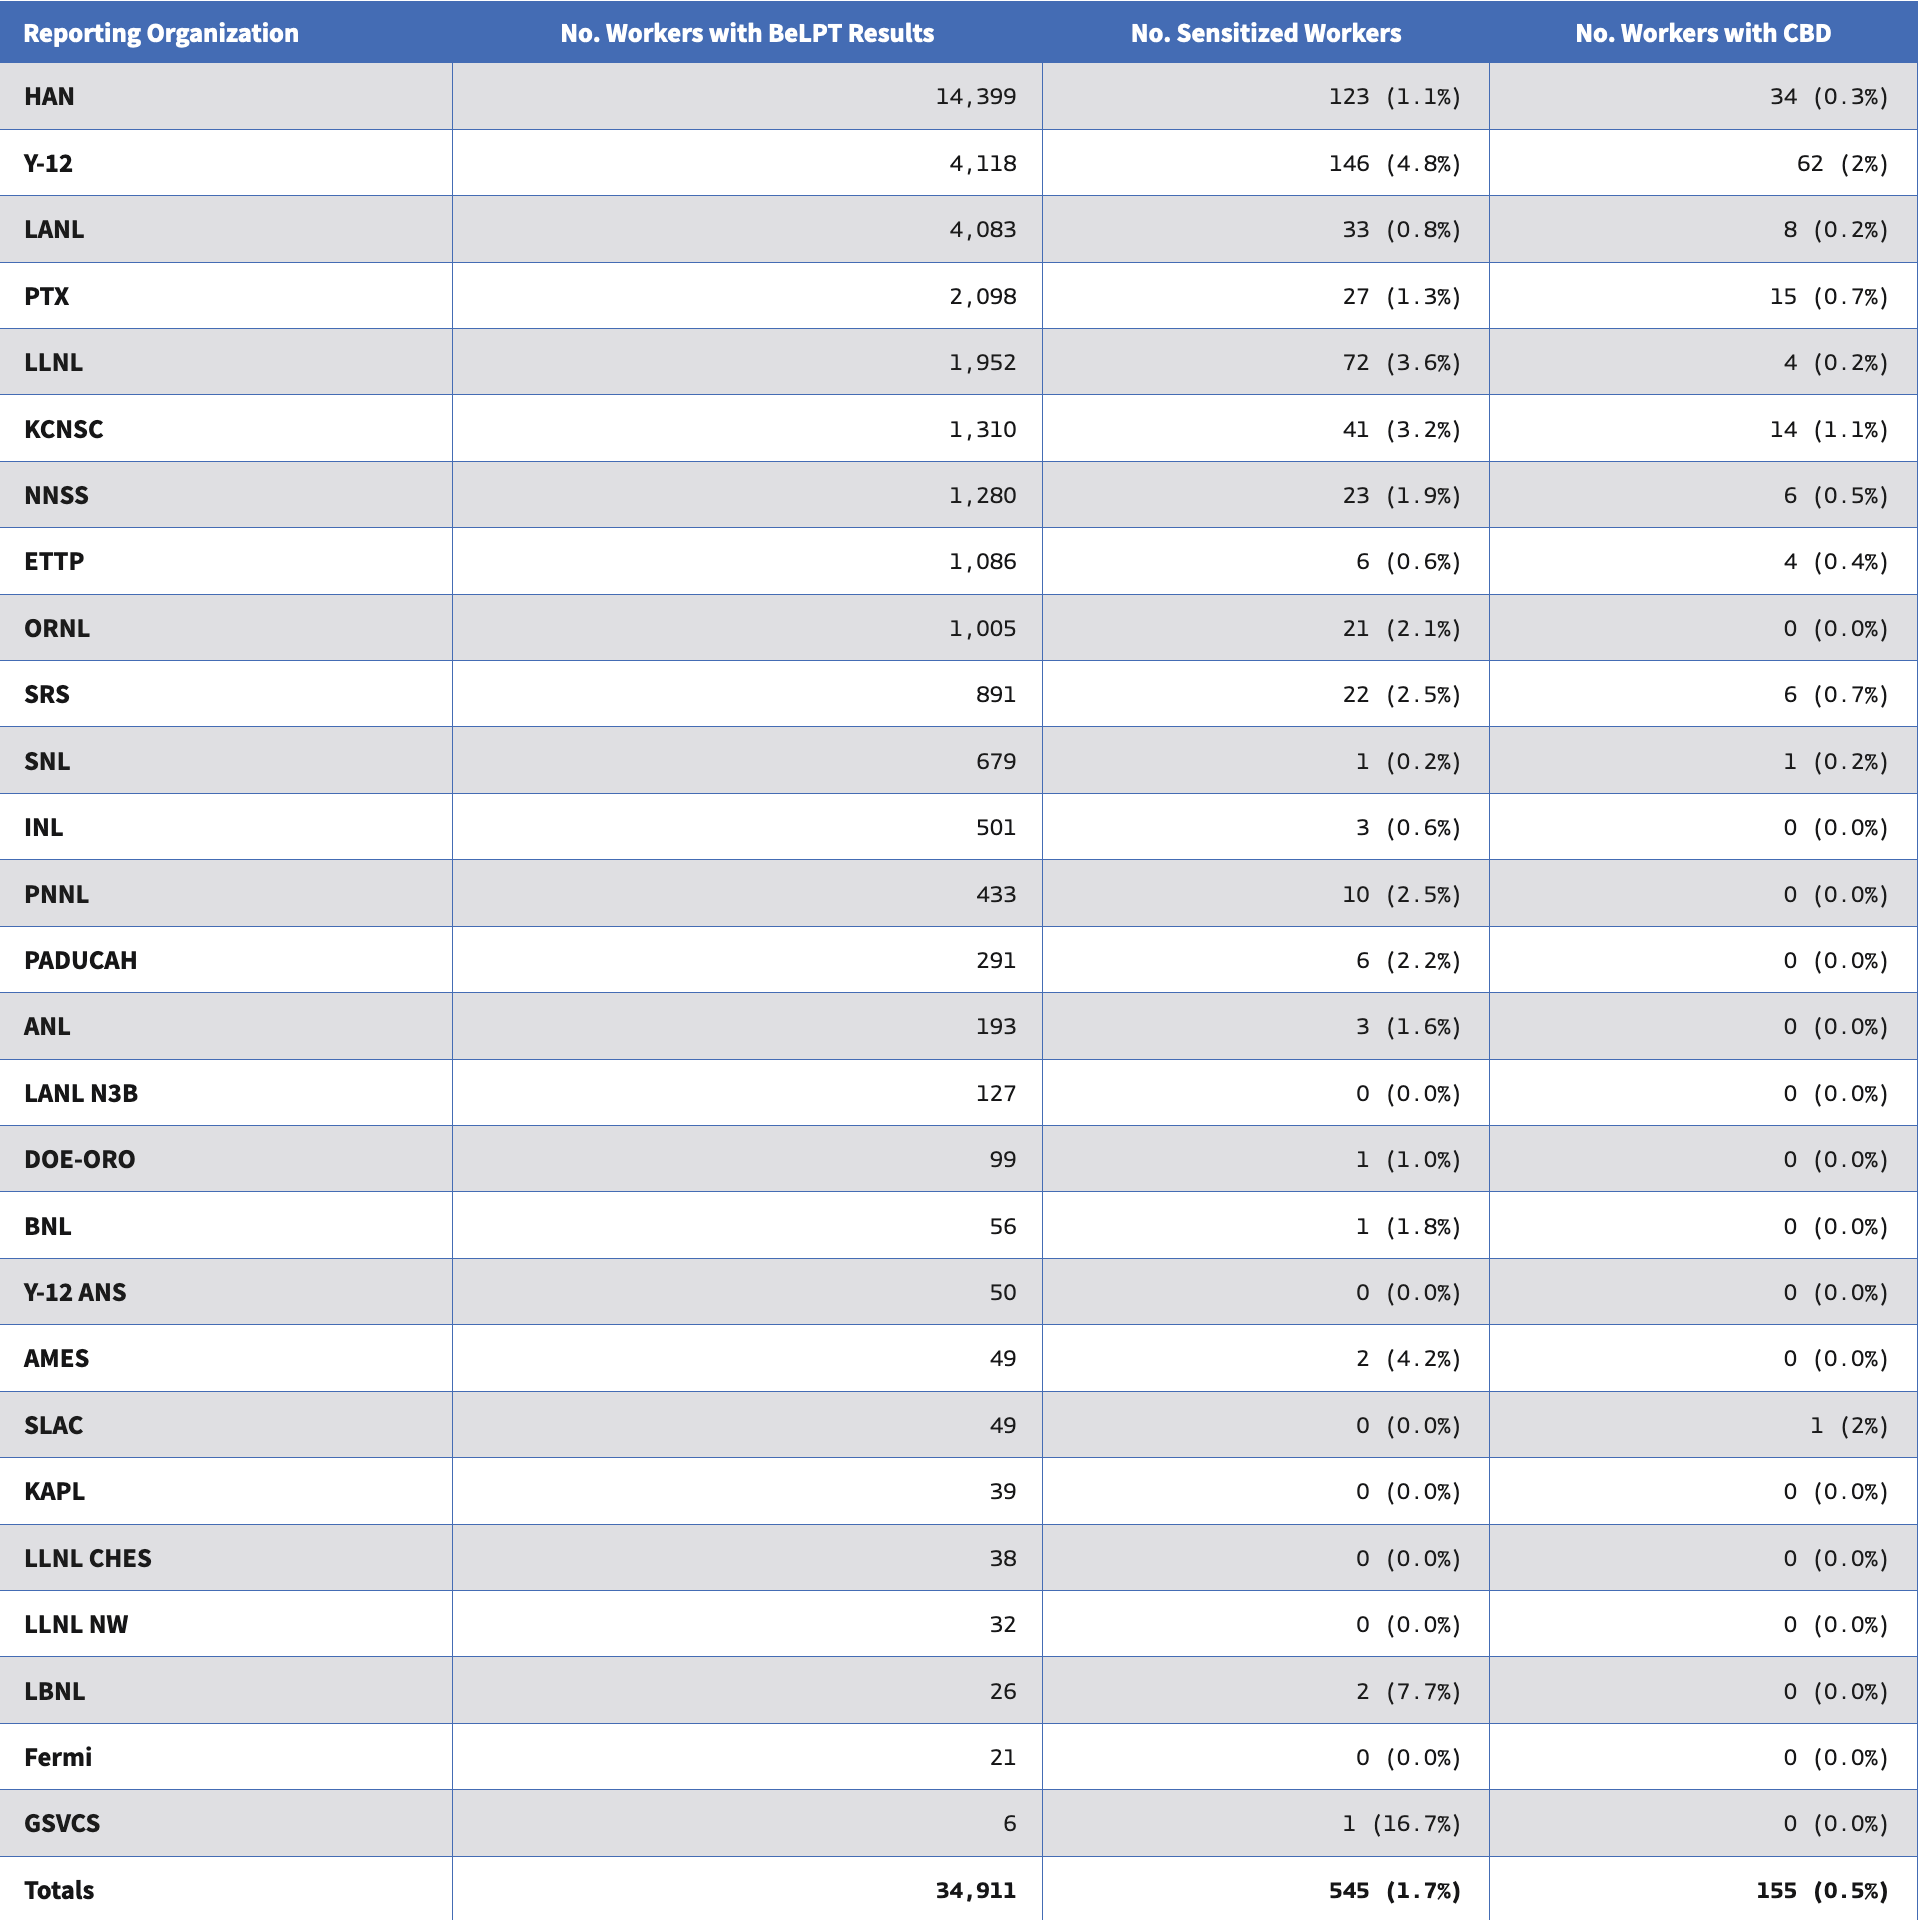
Reporting Organization No. Workers with BeLPT Results No. Sensitized Workers No. Workers with CBD HAN 16,409 125 (0.8%) 34 (0.2%) LANL 5,450 39 (0.7%) 8 (0.1%) Y-12 4,689 146 (3.1%) 63 (1.3%) PTX 2,314 27 (1.2%) 15 (0.6%) LLNL 2,132 73 (1.4%) 4 (0%) ETTP 1,555 7 (1.7%) 4 (0.4%) ORNL 1,521 21 (0.5%) 0 (0.3%) NNSS 1,393 23 (3.1%) 6 (1%) KCNSC 1,338 41 (1.9%) 14 (0.5%) SRS** 1,284 24 (3.4%) 7 (0.2%) SNL 690 1 (0.1%) 1 (0.1%) INL 546 3 (0.5%) 0 (0.0%) PNNL 517 10 (1.9%) 0 (0.0%) PADUCAH 308 6 (1.9%) 0 (0.0%) LANL N3B 244 1 (0.4%) 0 (0.0%) ANL 207 3 (1.4%) 0 (0.0%) DOE-ORO 108 1 (0.9%) 0 (0.0%) Y-12 ANS 64 0 (0%) 0 (0.0%) Ames Lab 63 2 (3.2%) 0 (0.0%) BNL 57 1 (1.8%) 0 (0.0%) SLAC 57 0 (0.0%) 1 (1.8%) LLNL NW 55 0 (0.0%) 0 (0.0%) KAPL 45 0 (0.0%) 0 (0.0%) LLNL CHES 37 0 (0.0%) 0 (0.0%) LBNL 26 2 (7.7%) 0 (0.0%) Fermi 21 0 (0.0%) 0 (0.0%) PORTS 13 4 (30.8%) 0 (0.0%) S&G 6 1 (16.7%) 0 (0.0%) PNNL AMC 6 0 (0.0%) 0 (0.0%) PNNL DGR 3 0 (0.0%) 0 (0.0%) Totals 41,158 561 (1.1%) 157 (0.3%) Click here for List of Acronyms
*Some reporting organizations have provided data that predate the 2002 start date of the registry.
**The new CBD case for CY2025 was at NNSA site.
This table provides the numbers of beryllium-associated workers with Beryllium Lymphocyte Proliferation Testing (BeLPT) test results submitted to the Beryllium-Associated Worker Registry each year. The total number of beryllium-sensitized (BeS) workers increased by 5 through Calendar Year 2025 (CY2025) (561 total BeS cases reported). The newly reported BeS cases were from 5 reporting organizations (1 HAN, 1 LANL, 1 LANL N3B, 1 ETTP, and 1 SRS).
Twenty-one (21) of the active reporting organizations have BeS workers and 11 have workers who have been diagnosed with chronic beryllium disease (CBD).
-
Number and Percent Proportion of Workers Undergoing BeLPT Testing, and Yielding Abnormal BeS or CBD Results (n=58,563) (2002–2025) *
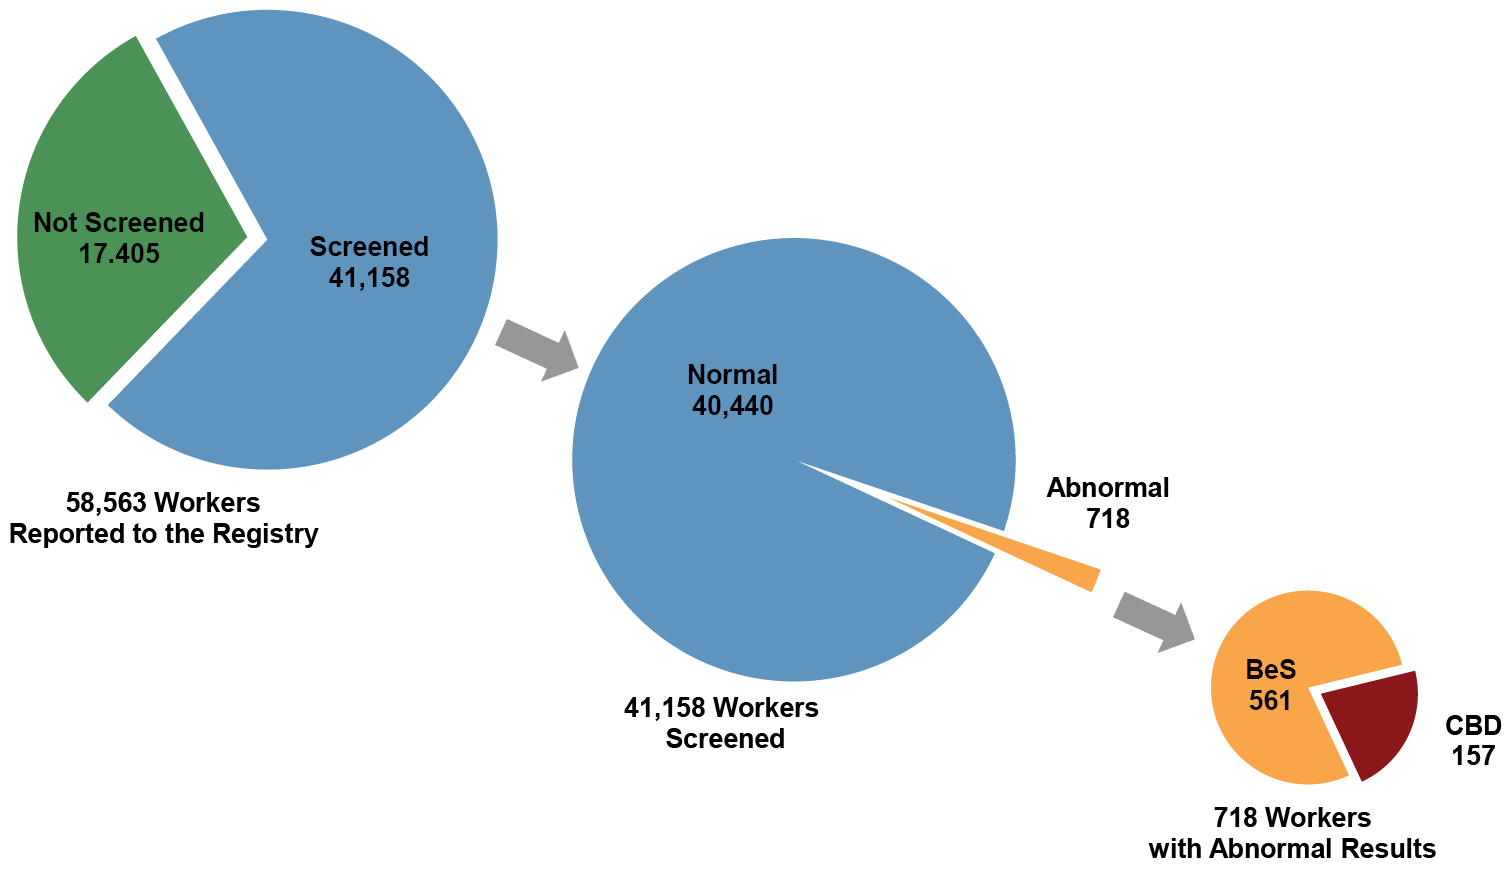
This figure depicts the numbers and percentages across the U.S. Department of Energy (DOE) complex of workers screened using the BeLPT and among those workers having abnormal results, how many are sensitized or have developed CBD. Comparison with previous years’ reports show that these DOE-wide percentage distributions have remained consistent.
*Some reporting organizations have provided data that predate the 2002 start date of the registry.
-
Percent Proportion of Workers Diagnosed as BeS by Reporting Organization (n=561) (2002–2025) *
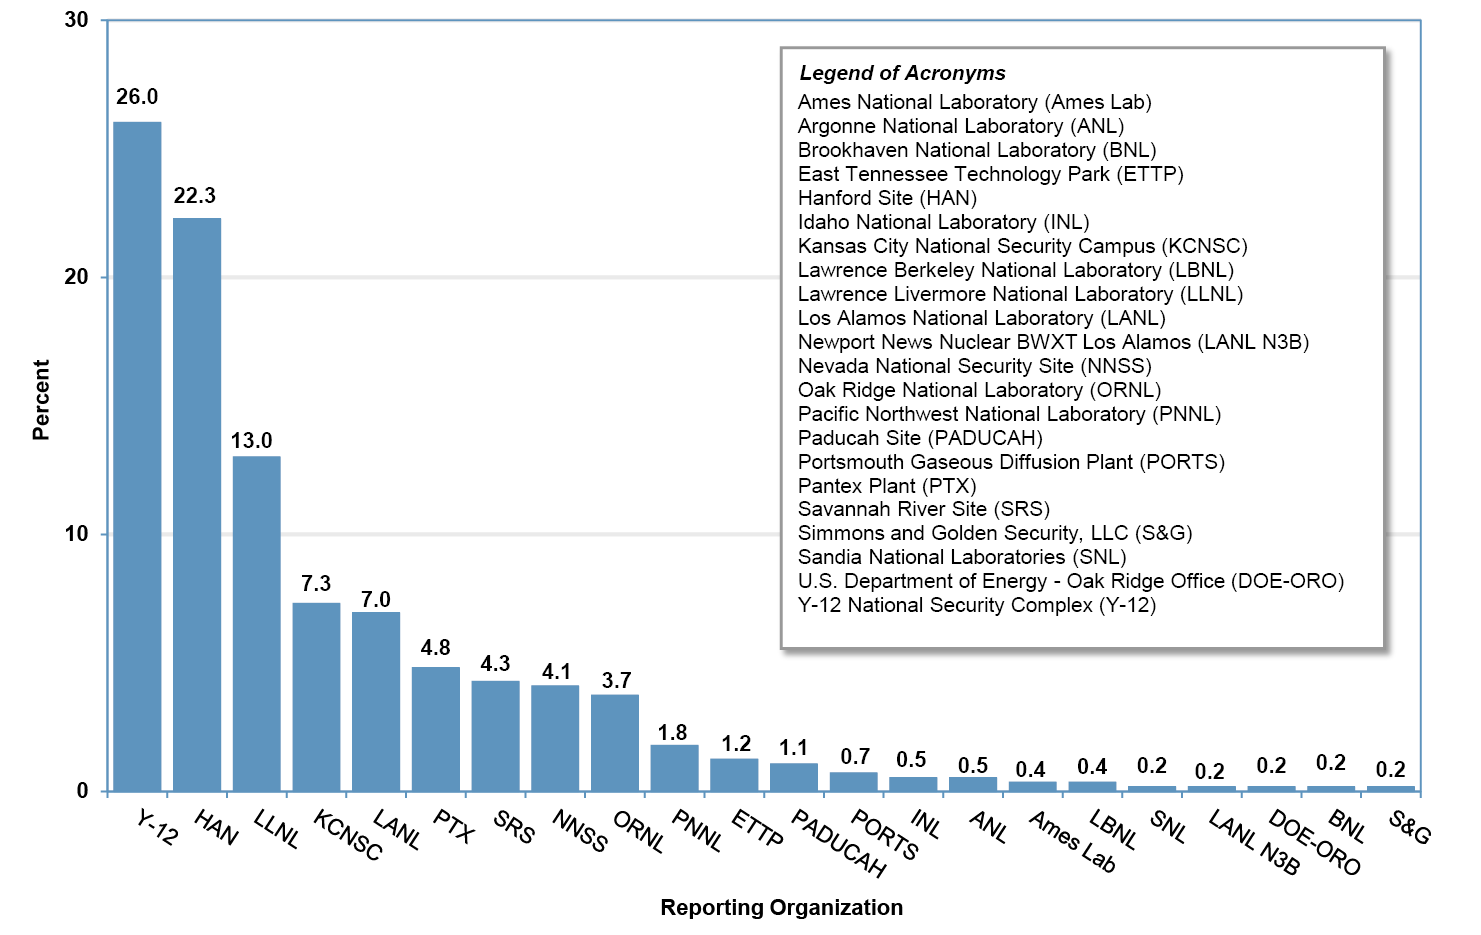
This figure presents the distribution in percent of beryllium sensitization (BeS) cases by reporting organization. Of the 15 reporting organizations with at least 1 reported Be sensitization, about 48.3% of total BeS cases are associated with the Y-12 and HAN sites, which also represent the largest beryllium operations in the program.
Ten BeS cases were reported to the Registry in CY2025, representing 5 reporting organizations (1 HAN, 1 LANL, 1 LANL N3B, 1 ETTP, and 1 SRS).
*Some reporting organizations have provided data that predate the 2002 start date of the registry.
-
Percent Proportion of Workers Diagnosed as CBD by Reporting Organization (n=157) (2002–2025) *
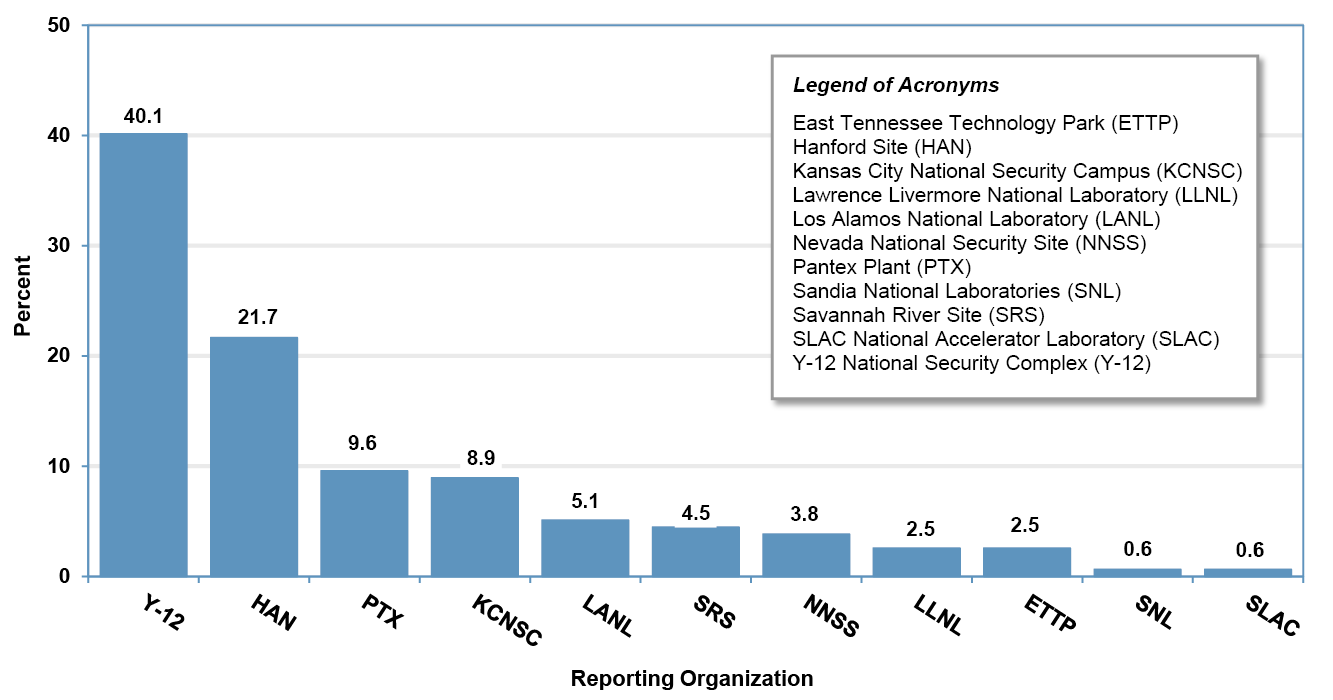
Of the 30 active sites, 11 reporting organizations have reported at least one worker diagnosed with chronic beryllium disease (CBD). This figure presents the distribution in percent for those 11 reporting organizations with workers diagnosed with CBD. Approximately 62% of total CBD cases are associated with the Y-12 and HAN sites.
*Some reporting organizations have provided data that predate the 2002 start date of the registry.
** One new CBD case was identified in CY2025 at SRS.
-
Number and Percent of Workers Categorized by Number of Years Following Hire Date, Undergoing BeLPT and Diagnosed with BeS or Diagnosed with CBD (n=58,563) (2002–2025) *
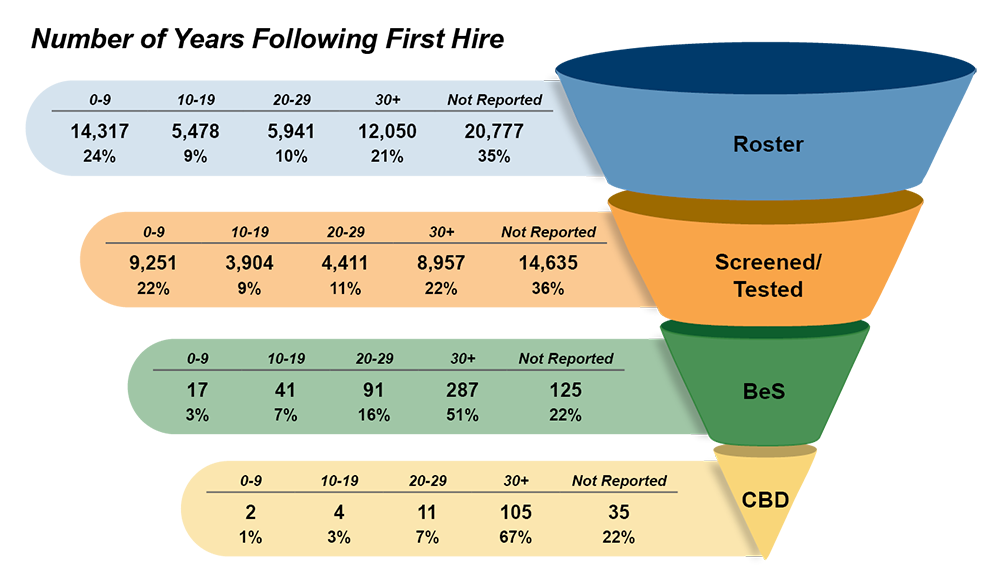
This figure shows the number of beryllium-associated workers categorized by years following first hire, undergoing Beryllium Lymphocyte Proliferation Testing (BeLPT) tests. This includes roster total, those screened, and those with beryllium sensitization (BeS) or chronic beryllium disease (CBD).
For both BeS and CBD diagnoses, the majority of workers have been in a beryllium-associated job position for twenty or more years. However, it should also be pointed out that a significant number of workers do not have hire date reported, and the numbers of years post-hire cannot be calculated.
*Some reporting organizations have provided data that predate the 2002 start date of the registry.
-
Number of Workers Undergoing BeLPT and Diagnosed with BeS or Diagnosed with CBD (n=41,158) (2002–2025) *
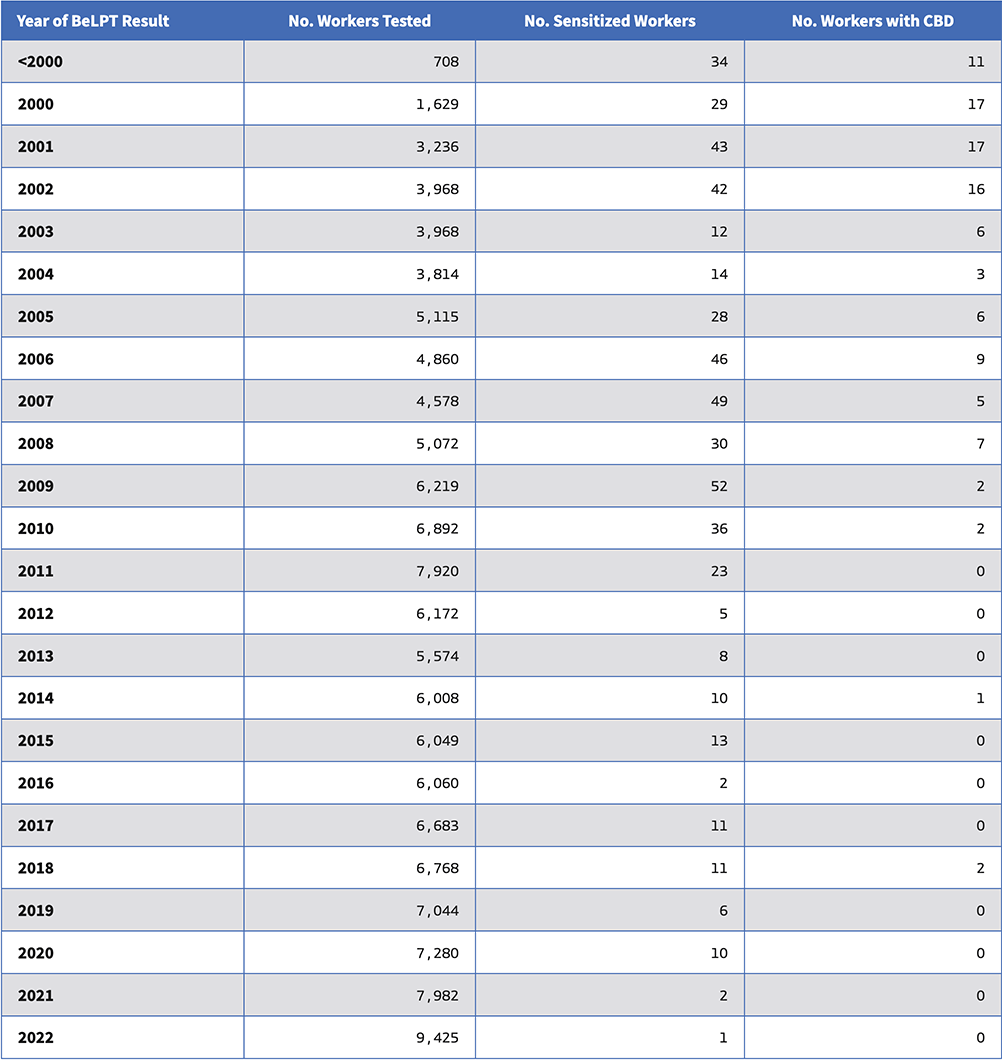
This table provides the numbers of beryllium-associated workers with Beryllium Lymphocyte Proliferation Testing (BeLPT) results submitted to the Beryllium-Associated Worker Registry each year, and the year of first positive or abnormal BeLPT result for those who were beryllium-sensitized (BeS) or diagnosed as having chronic beryllium disease (CBD). First positive or abnormal BeLPT result is an important medical surveillance sentinel, resulting in earlier or more frequent repeat testing, hence, earlier diagnosis, earlier work restrictions, and more successful treatment. It is also a criterion for eligibility for compensation and payment of medical expenses under the Energy Employees Occupational Illness Compensation Program Act (EEOICPA). Two (2) abnormal BeLPT results or 1 abnormal and 2 borderline BeLPT results are required to categorize a worker as BeS. Since a worker may choose not to have repeat BeLPT measurements, may change work and have long lags between measurements, or may not test abnormal for a period of time, the year of first BeLPT provides a more reliable metric than the year a worker becomes BeS.
Year of BeLPT Result Total No. Workers Tested No. Sensitized Workers No. Workers with CBD <2000 708 34 11 2000 1,629 29 17 2001 3,236 43 17 2002 3,968 42 16 2003 3,968 12 6 2004 3,814 14 3 2005 5,115 28 6 2006 4,860 46 9 2007 4,578 49 5 2008 5,072 30 7 2009 6,219 52 2 2010 6,892 36 2 2011 7,920 23 0 2012 6,172 5 0 2013 5,574 8 0 2014 6,008 10 1 2015 6,049 13 0 2016 6,060 2 0 2017 6,683 11 0 2018 6,768 11 2 2019 7,044 6 0 2020 7,280 10 0 2021 7,982 2 0 2022 9,425 1 0 2023 6,444 1 0 2024 8,026 10 1 2025 8,633 5 1 Year Not Reported 0 28 51 * The number of "Workers Tested" includes all testing with results of Normal, Negative, Borderline, Positive, Abnormal, and Unsatisfactory. Workers tested periodically are included in each year they were tested. Data capture includes prior to the year 2002.
-
Number and Percent Proportion of Workers with Abnormal BeLPT Results BeS or CBD Results by Job Category (n=41,158) (2002–2025) *
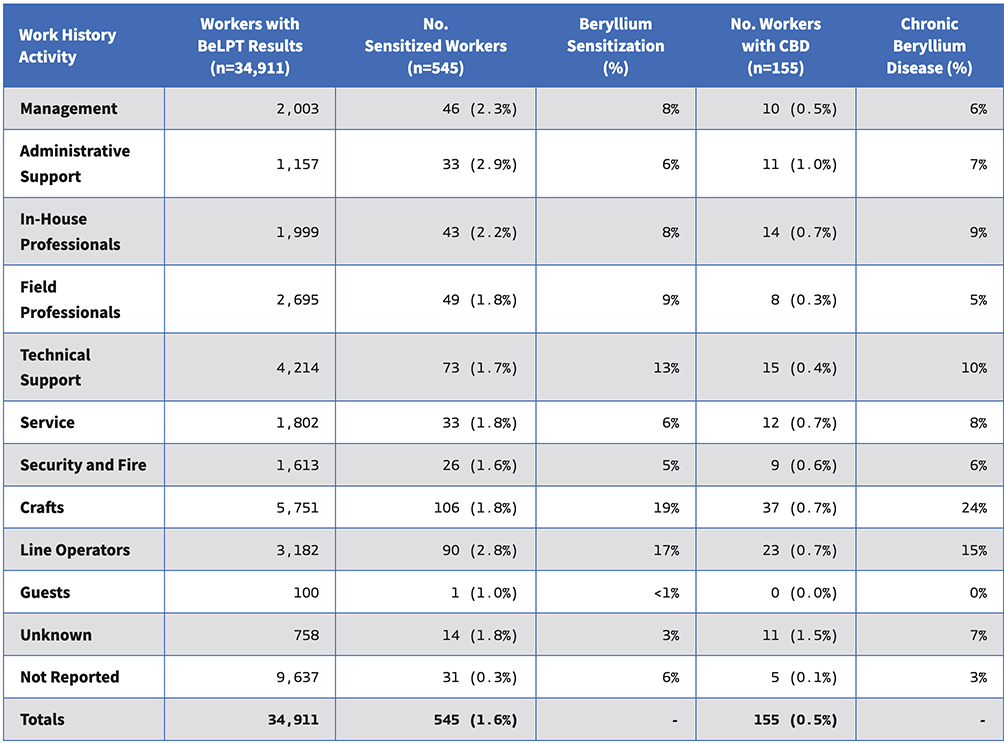
The yearly average for workers developing sensitization, whose first abnormal Beryllium Lymphocyte Proliferation Test (BeLPT) results between Calendar Year 2001 (CY2001) and CY2010, was 35. This rate dropped to an average of 6 from CY2015 to CY2025. These results suggest that programs are serving to improve worker protection and reduce the risk of chronic beryllium disease (CBD).
This table lists beryllium-sensitized (BeS), or CBD diagnosed workers, through CY2025 grouped by their work history activity, which is a high‑level rollup of job function. Based on the data submitted through CY2025 and as presented in the table, the majority of both reported BeS (36%) and CBD cases (39%) occurred among the broad occupational groups of Crafts and Line Operators.
Work History Activity Workers with BeLPT Results (n=41,158) No. Sensitized Workers (n=556) Beryllium Sensitization (%) No. Workers with CBD (n=157) Chronic Beryllium Disease (%) Management 1,975 47 (2.1%) 8% 10 (0.5%) 6% Administrative Support 956 32 (2.7%) 6% 11 (0.9%) 7% In-House Professionals 1,993 42 (2.0%) 8% 15 (0.7%) 10% Field Professionals 2,827 50 (1.6%) 9% 8 (0.3%) 5% Technical Support 4,471 75 (1.6%) 13% 15 (0.3%) 10% Service 1,735 34 (1.8%) 6% 12 (0.6%) 8% Security and Fire 1,262 27 (1.6%) 5% 9 (0.5%) 6% Crafts 6,246 108 (1.6%) 19% 38 (0.6%) 24% Line Operators 3,228 93 (2.5%) 17% 23 (0.6%) 15% Guests 105 1 (1.1%) <0.1% 0 (0%) <0.1% Unknown 812 14 (1.7%) 3% 11 (1.3%) 7% Not Reported 15,548 33 (0.3%) 6% 5 (<0.1%) 3% Totals 41,158 556 (1.4%) 157 (0.4%) Click here for List of Acronyms
*Some reporting organizations have provided data that predate the 2002 start date of the Registry.
-
Comparison of the Number and Percent Proportion of Workers Undergoing BeLPT to the Number of Workers with BeLPT Results by Reporting Organization (n=8,633) (2025)
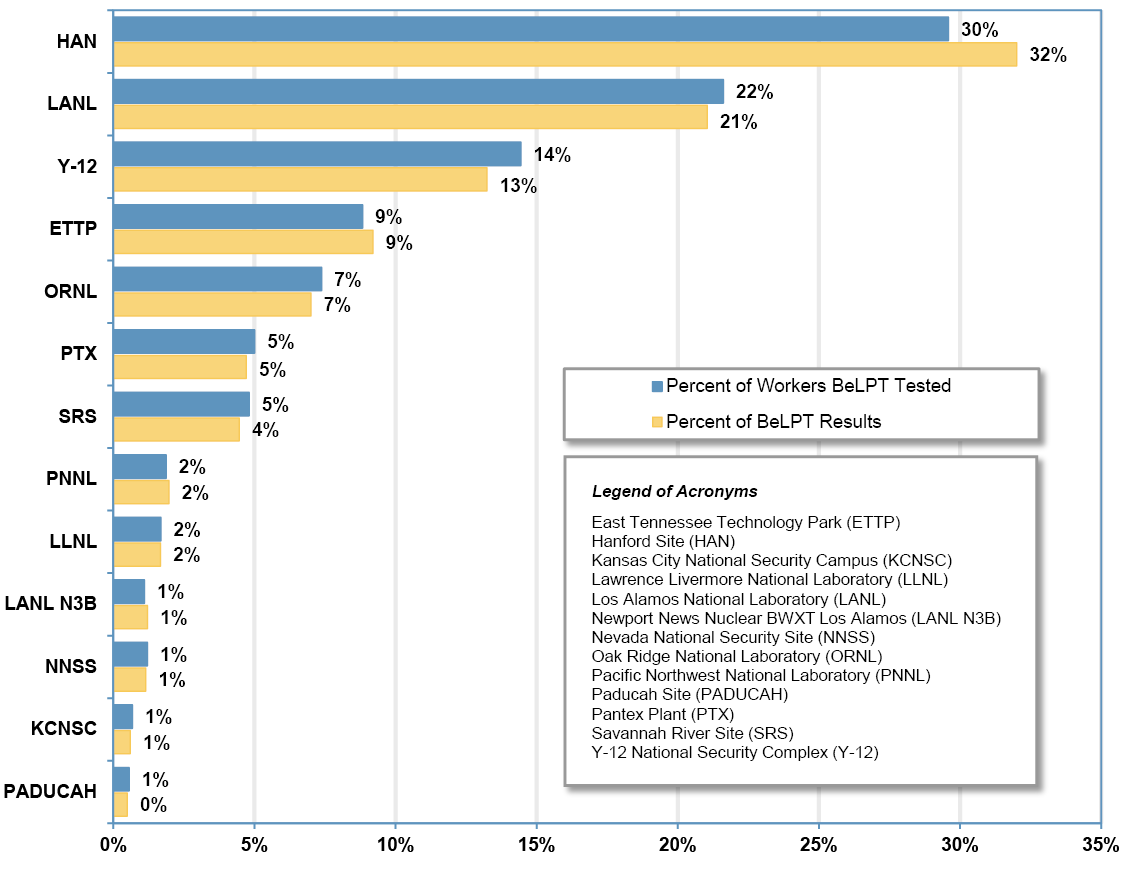
This figure compares the percent of Beryllium Lymphocyte Proliferation Tests (BeLPTs) tests conducted to the number of workers tested for each reporting organization in Calendar Year 2025. Workers may be BeLPT tested multiple times in a year if they have abnormal or borderline results. Therefore, the number of BeLPT tests conducted are higher than the number of workers tested.
Exposure Monitoring Results
The Beryllium-Associated Worker Registry receives beryllium-related work history and exposure data. The submission contains information about all activities with the potential for beryllium exposure including where the beryllium-associated worker currently works or previously worked, and the exposures associated with those activities. Reporting organization staff collect retrospective work history information through questionnaires and interviews with the worker or from records if accessible. This information includes location, organization, and job title for workers who work directly with beryllium, work in areas of potential beryllium exposure, even if not working directly with beryllium, and activities with potential casual exposure to beryllium, such as working near an area where others are working directly with beryllium.
Exposure Monitoring Trends - Workers
The cumulative number of workers monitored through Calendar Year 2025 (CY2025) was 7,726 compared to 9,449 workers monitored through CY2024 as reported in the Beryllium-Associated Worker Registry 2024 Dashboard. This equates to a decrease of 1,723 workers monitored for exposure to beryllium through CY2025.
Sixteen (16) reporting organizations provided exposure monitoring results with monitoring dates in CY2025. Organization-specific totals for a given year may change from totals in previous annual reports due to late reporting and/or corrections.
-
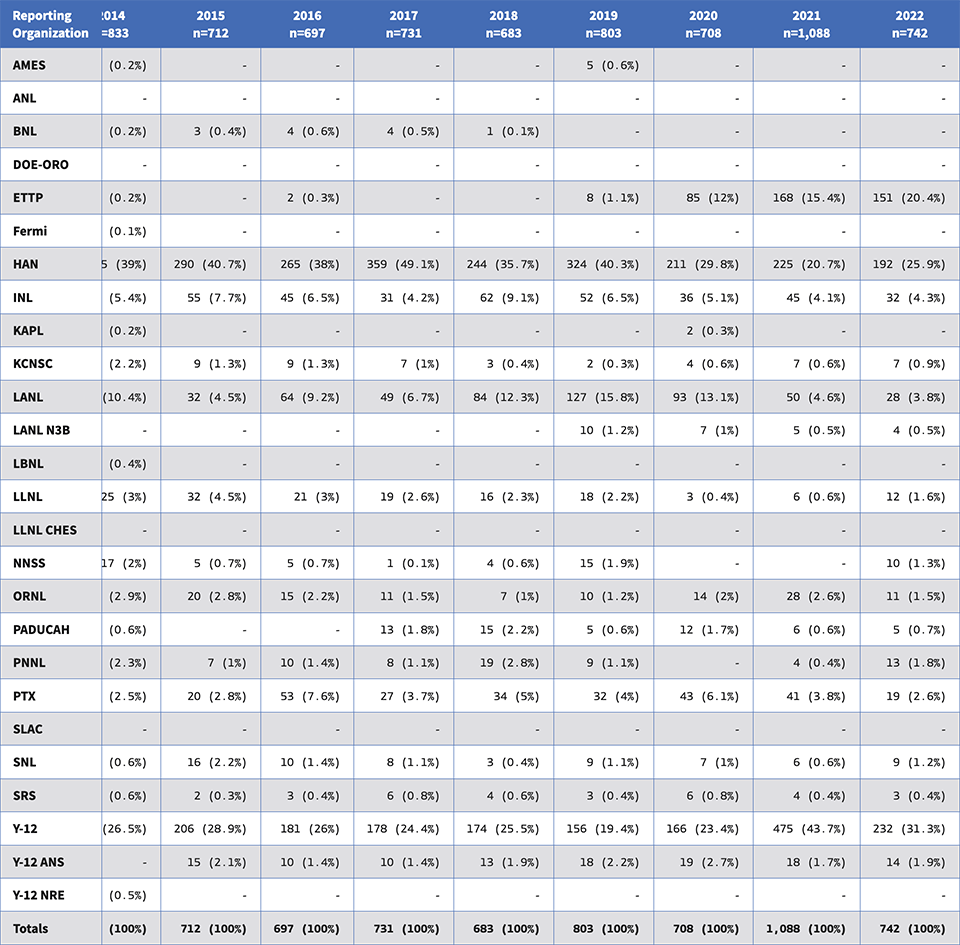
Number and Percent of Workers Monitored by Reporting Organization (unique workers n=4,374) (2016–2025) *
Reporting Organization 2016
n=6972017
n=7312018
n=6852019
n=8032020
n=7082021
n=1,0922022
n=7952023
n=7392024
n=7192025
n=754Ames Lab 0 (0.0%) 0 (0.0%) 0 (0.0%) 5 (0.6%) 0 (0.0%) 0 (0.0%) 0 (0.0%) 0 (0.0%) 0 (0.0%) 0 (0.0%) BNL 4 (0.6%) 4 (0.5%) 1 (0.1%) 0 (0.0%) 0 (0.0%) 0 (0.0%) 0 (0.0%) 0 (0.0%) 3 (0.4%) 0 (0.0%) DOE-ORO 0 (0.0%) 0 (0.0%) 0 (0.0%) 0 (0.0%) 0 (0.0%) 2 (0.2%) 2 (0.2%) 0 (0.0%) 0 (0.0%) 0 (0.0%) ETTP 2 (0.3%) 0 (0.0%) 0 (0.0%) 8 (1.0%) 85 (12.0%) 168 (17.9%) 153 (17.6%) 157 (21.2%) 74 (9.4%) 58 (7.7%) HAN 265 (38.0%) 359 (49.1%) 244 (35.4%) 324 (40.1%) 211 (29.7%) 225 (24.0%) 192 (22.1%) 154 (20.8%) 240 (30.3%) 156 (20.7%) INL 45 (6.5%) 31 (4.2%) 62 (9.0%) 52 (6.4%) 36 (5.1%) 45 (4.8%) 32 (3.7%) 27 (3.6%) 0 (0.0%) 0 (0.0%) KAPL 0 (0.0%) 0 (0.0%) 0 (0.0%) 0 (0.0%) 2 (0.3%) 0 (0.0%) 0 (0.0%) 0 (0.0%) 0 (0.0%) 0 (0.0%) KCNSC 9 (1.3%) 7 (1.0%) 3 (0.4%) 2 (0.2%) 4 (0.6%) 7 (0.7%) 6 (0.7%) 4 (0.5%) 7 (0.9%) 2 (0.3%) LANL 64 (9.2%) 49 (6.7%) 85 (12.3%) 127 (16.0%) 93 (13.1%) 50 (5.3%) 29 (3.3%) 7 (0.9%) 35 (4.4%) 83 (11.0%) LANL N3B 0 (0.0%) 0 (0.0%) 0 (0.0%) 10 (1.2%) 7 (1.0%) 5 (0.5%) 4 (0.5%) 0 (0.0%) 0 (0.0%) 0 (0.0%) LLNL 21 (3.0%) 19 (2.6%) 16 (2.3%) 18 (2.2%) 3 (0.4%) 6 (0.6%) 12 (1.4%) 5 (0.7%) 2 (0.3%) 8 (1.1%) LLNL NW 0 (0.0%) 0 (0.0%) 0 (0.0%) 0 (0.0%) 0 (0.0%) 0 (0.0%) 0 (0.0%) 1 (0.1%) 0 (0.0%) 0 (0.0%) NNSS 5 (0.7%) 1 (0.1%) 4 (0.6%) 15 (1.9%) 0 (0.0%) 0 (0.0%) 10 (1.2%) 8 (1.1%) 9 (1.1%) 9 (1.2%) ORNL 15 (2.2%) 11 (1.5%) 7 (1.0%) 10 (1.2%) 14 (2.0%) 28 (3.0%) 11 (1.3%) 7 (0.9%) 8 (1.0%) 22 (2.9%) PADUCAH 0 (0.0%) 13 (1.8%) 15 (2.2%) 5 (0.6%) 12 (1.7%) 6 (0.6%) 5 (0.6%) 2 (0.3%) 5 (0.6%) 17 (2.3%) PNNL 10 (1.4%) 8 (1.1%) 19 (2.8%) 9 (1.1%) 0 (0.0%) 4 (0.4%) 12 (1.4%) 7 (0.9%) 2 (0.3%) 6 (0.8%) PNNL AMC 4 (0.5) 2 (0.3%) PNNL DGR 2 (0.3%) 1 (0.1%) PORTS 1 (0.1%) 0 (0.0%) 0 (0.0%) 0 (0.0%) 0 (0.0%) PTX 53 (7.6%) 27 (3.7%) 34 (4.9%) 32 (4.0%) 43 (6.0%) 42 (4.5%) 19 (2.2%) 42 (5.7%) 30 (3.8%) 24 (3.2%) SNL 10 (1.4%) 8 (1.1%) 4 (0.6%) 9 (1.1%) 7 (1.0%) 6 (0.6%) 9 (1.0%) 13 (1.8%) 7 (0.9%) 7 (0.9%) SRS 3 (0.4%) 6 (0.8%) 4 (0.6%) 3 (0.4%) 6 (0.8%) 4 (0.4%) 3 (0.3%) 4 (0.5%) 12 (1.5%) 3 (0.4%) Y-12 181 (26.0%) 178 (24.4%) 178 (25.8%) 158 (19.6%) 169 (23.8%) 322 (34.3%) 354 (40.8%) 293 (39.6%) 338 (42.7%) 345 (45.8%) Y-12 ANS 10 (1.4%) 10 (1.4%) 13 (1.9%) 18 (2.2%) 19 (2.7%) 18 (1.9%) 14 (1.6%) 9 (1.2%) 13 (1.6) 11 (1.5%) Totals 697 (100%) 731 (100%) 689 (100%) 807 (100%) 711 (100%) 939 (100%) 867 (100%) 740 (100%) 791 (100%) 754 (100%) Click here for List of Acronyms
* Some reporting organizations have provided data that predate the 2002 start date of the Registry
An industrial hygienist monitored exposure for workers by reporting organization at least once in each year for the past 10 years (i.e., between 2016 and 2025).
-
Number and Percent Proportion of Workers Undergoing Beryllium Exposure Monitoring by Reporting Organization (n=9,659) (2002-2025) *
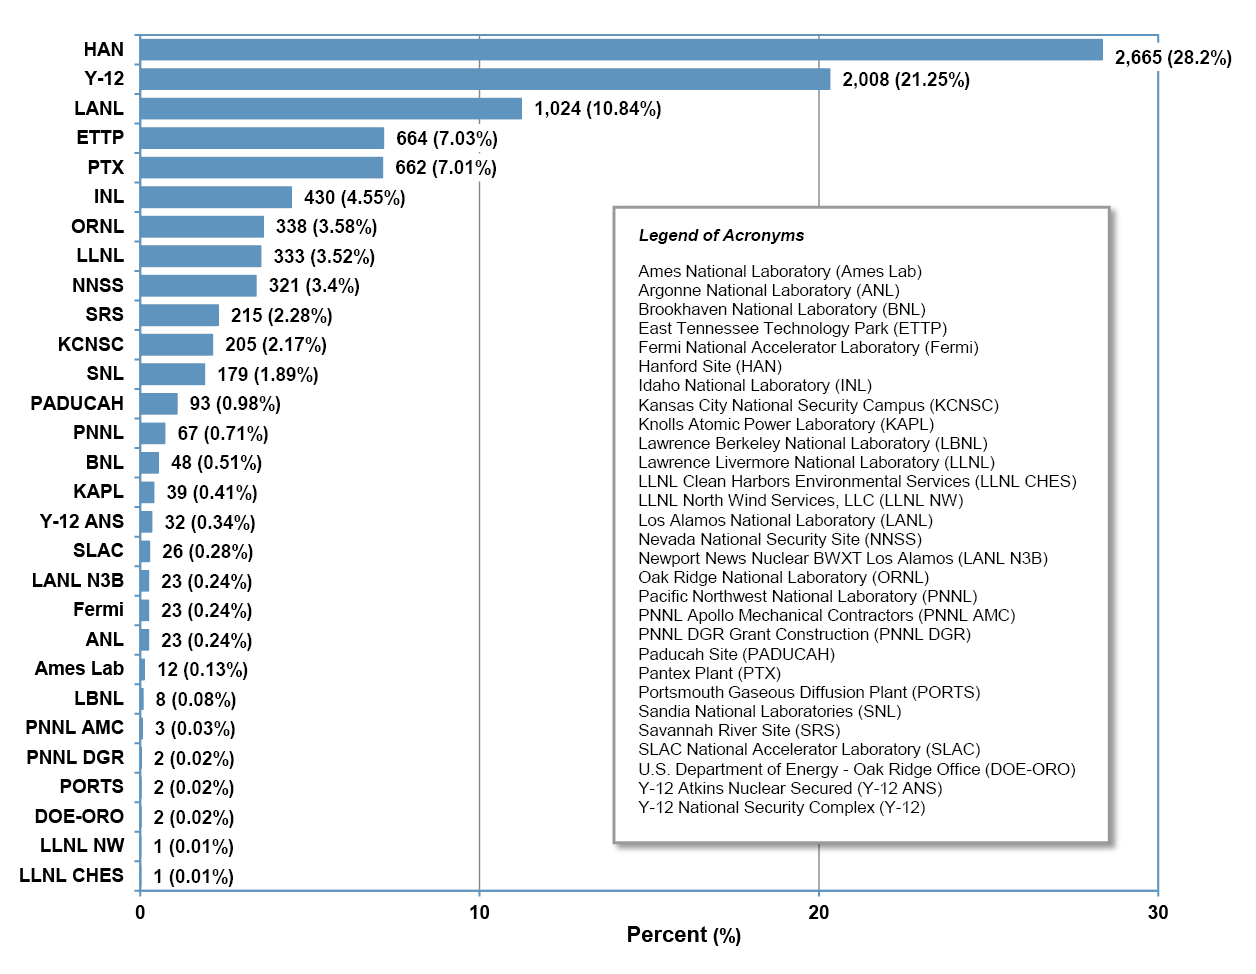
This figure displays the cumulative 9,659 beryllium-associated workers monitored for beryllium exposure in Calendar Years 2002–2025 by reporting organization.
*Some reporting organizations have provided data that predate the 2002 start date of the registry.
Exposure Monitoring Trends - Samples
-
Number and Percent Proportion of Exposure Sample Results by Year (n=39,664) (2016–2025) *
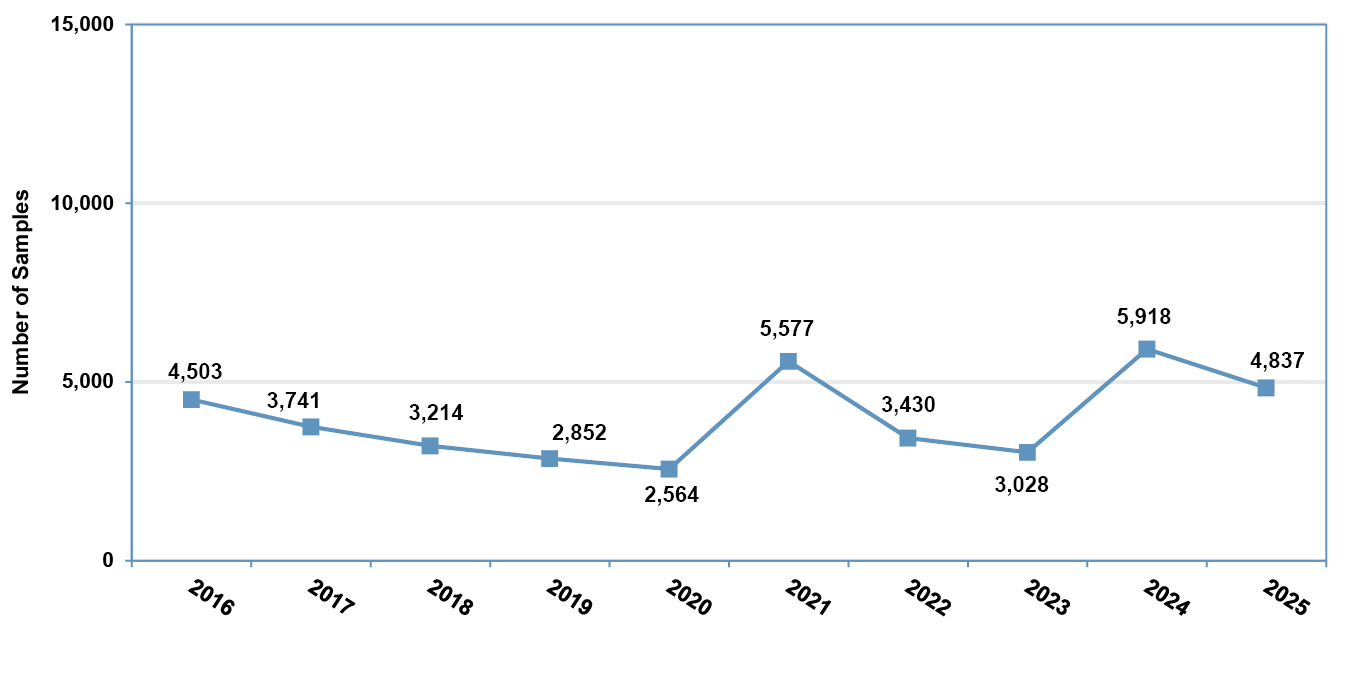
The numbers of exposure sampling results in the Beryllium-Associated Worker Registry (BAWR) by year monitored for each of the past 10 years are shown in the line chart.
As can be seen, the numbers have steadily declined in recent years, with an uptick in CY2021 and CY2025. The reporting organizations that collected and submitted exposure monitoring sample data show a downward trend which, in some cases, impact the analysis and interpretation of results in BAWR. The small sample size reduces accuracy and leads to higher variability in the statistical models used for the BAWR analyses. Calendar Year 2024 had the highest number of samples in the past 10 years. Calendar Year 2025, the number of exposure records submitted was slightly fewer than the previous year but still remained higher than the 10 year average of 3,996 records.
-
Comparison of the Number and Percent Proportion of Exposure Samples to Workers with Exposure Sampling Results by Reporting Organizations (n=754) (2025)
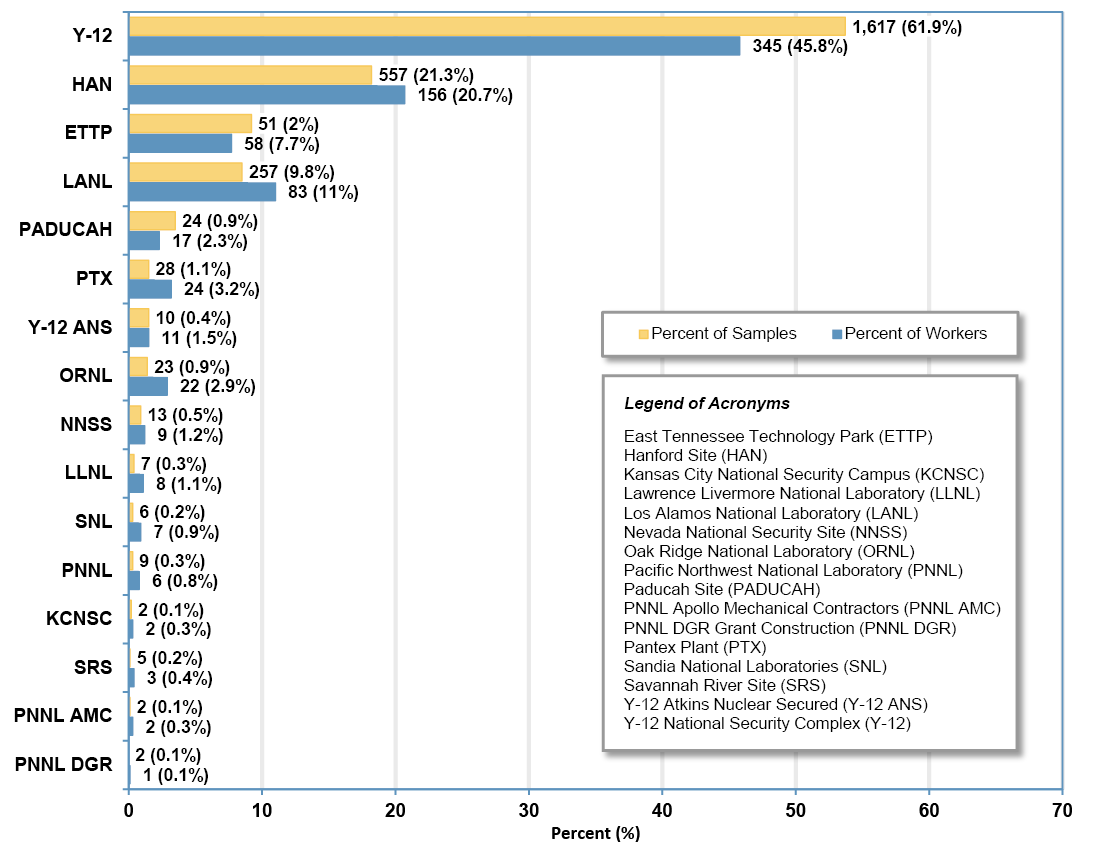
Only 16 of the 30 active sites reported exposure samples to BAWR in CY2025. This graphic illustrates the distribution of exposure samples and workers monitored across those 16 reporting organizations during. Similar to the beryllium screening results, most workers monitored for beryllium exposure have multiple exposure measurements throughout the year. The frequency of monitoring is dependent on the worker’s specific type of work and their employer’s monitoring schemes.
Reporting organizations submitted a total of 133,983 exposure measurements to the Beryllium-Associated Worker Registry (BAWR) through Calendar Year 2025 (CY2025). This equates to 4,829 exposure sampling results collected and submitted in CY2025.
-
Number and Percent Proportion of Non-Detectable Results Exposure Measurements, Detectable Exposure Measurement Results and Exposure Measurement Status Not Reported (n=133,983) (2002–2025 ) *
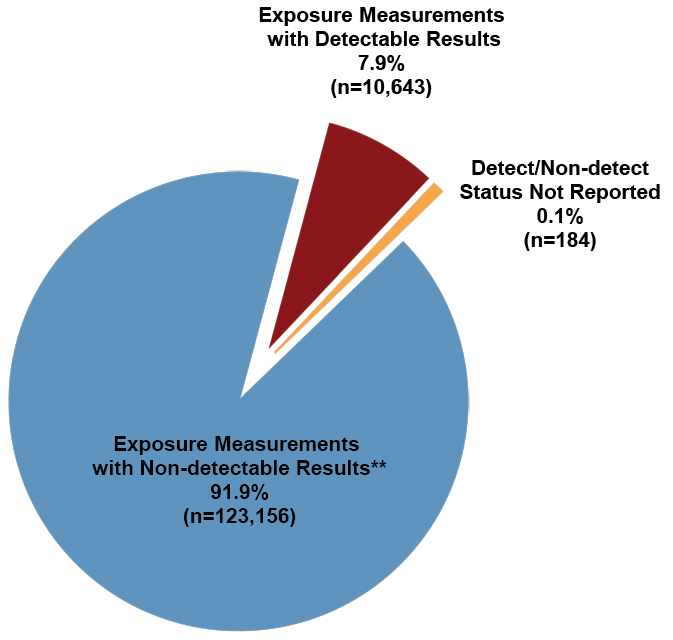
Of the 133,983 cumulative exposure monitoring records submitted to the Registry through Calendar Year 2025 (CY2025), 91.9% have “non-detectable” results, indicating that the sample analysis results were less than the laboratory’s reporting limit. The reporting limit can vary from sample to sample because of differing flow rates of the sampling equipment used and because of the presence of other materials on the sample that can interfere with the analysis. Reporting limits typically vary from 0.01 to 0.05 µg/m3, which is one‑twentieth to one-quarter of the action level of 0.2 µg/m3.
In comparison, 4,829 records (including those monitoring dates in CY2024 and earlier) were submitted to the Registry in CY2025. This increase in sampling results is higher than the 3,680 records submitted in CY2022 and 2,734 records submitted in CY2023, but lower than the 5,918 samples submitted in CY2024.
*Some reporting organizations have provided data that predate the 2002 start date of the registry.
**Non-detectable indicates that analysis results were reported as less than the laboratory's reporting limit.
Trends in Exposure Levels
-
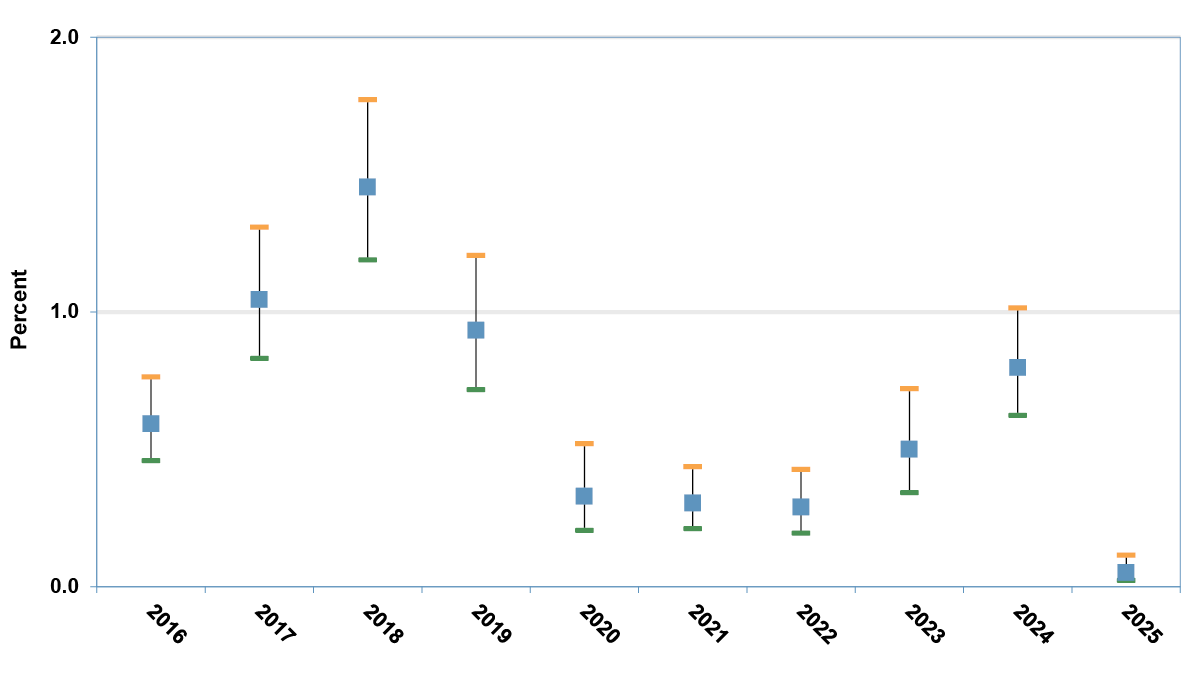
Percent of 8-hour time weighted average (TWA) Exceeding Action Level 0.2 µg/m3 by Year (2016–2025) *
Mouse over or click a data point to view additional information.
* Some reporting organizations have provided data that predate the 2002 start date of the registry. Percent exceeding 0.2 μg/m3 based on 95% Confidence Limits
This figure shows the percentage of DOE-wide 8-hour time weighted average (TWA) personal exposure monitoring results that exceeded the action level of 0.2 μg/m3 in each of the 10 years from Calendar Year 2016 (CY2016) to CY2025.
Summary Statistics for 2016–2025 8-Hour Time Weighted Average Exposure Monitoring Results * Year 2016 2017 2018 2019 2020 2021 2022 2023 2024 2025 10-year Summary Number of reported monitoring results 4,461 (13%) 3,405 (9.9%) 3,166 (9.2%) 2,804 (8.2%) 2,517 (7.3%) 4,738 (13.8%) 4,064 (11.8%) 2,736 (8%) 4,060 (11.8%) 2,449 (7.1%) 34,400 (100%) Number of detected values 241 (17.9%) 175 (13%) 243 (18.1%) 168 (12.5%) 71 (5.3%) 79 (5.9%) 85 (6.3%) 65 (4.8%) 144 (10.7%) 72 (5.4%) 1,343 (100%) Percent non-detects 94.6 94.9 92.3 94 97.2 98.3 97.9 97.6 96.5 97.1 96.1 Number of individuals monitored 694 (16.1%) 730 (17%) 689 (16%) 807 (18.8%) 711 (16.5%) 939 (21.8%) 843 (19.6%) 723 (16.8%) 773 (18%) 718 (16.7%) 4,304 (100%) Arithmetic mean (EX) (µg/m3) 0.016 0.842 0.398 0.164 0.021 0.230 0.036 1.752 2,793 0.001 0.114 Lower confidence limit of EX (µg/m3) 0.008 0.128 0.108 0.38 0.003 0.011 0.005 0.031 0.188
0.001 0.067 Upper confidence limit of EX (µg/m3) 0.031 5.521 1.468 0.700 0.140 5.015 0.280 97.785 41.435 0.002 0.195 Observed 95th percentile of data (µg/m3) 0.005 0.006 0.020 0.011 0.001 <0.01 <0.01 0.003 <0.01 0.008 0.004 95% upper tolerance limit of the 95th percentile (µg/m3) 0.020 0.020 0.031 0.026 0.012 0.013 0.011 0.011 0.011 0.009 0.016 Largest value (µg/m3) 8.865 87.419 16.712 23.084 17.340 6.609 2.897 37.536 16.368 0.200 87.419 Percent exceeding 0.2 µg/m3 (F) 0.6 1.0 1.5 0.9 0.3 0.3 0.3 0.5 0.8 0.1 0.6 Lower confidence limit for F 0.5 0.8 1.2 0.7 0.2 0.2 0.2 0.3 0.6 0.0 0.6 Upper confidence limit for F 0.8 1.3 1.8 1.2 0.5 0.4 0.4 0.7 1.0 0.1 0.7 * Many individuals were monitored in more than 1 year. The total number of individuals measured at least once in the 10-year period from CY2016 through CY2025 is 4,374. Some reporting organizations have provided data that predate the CY2002 start date of the registry. Percent exceeding 0.2 μg/m3 based on 95% Confidence Limits.
The detailed data presented in the table above provide additional summary statistics for the DOE-wide 8-hour TWA results for each of the past 10 years.
These statistical methods accommodate the high percentage of non-detect results (left censored) in these data sets. These analyses exclude non-detected values greater than 0.2 µg/m3. For details, see “Statistical Methods and Software for the Analysis of Occupational Exposure Data with Non-Detectable Values” Frome EL and Wambach PF, ORNL/TM-2005/52.
Totals for an individual year may vary from previous reports due to late reporting and/or corrections. The data reported in the Beryllium-Associated Worker Registry indicate that the chronic beryllium disease prevention programs operated at DOE sites have continued to maintain a compliance with the 10 CFR 850 action level of 0.2 µg/m3 over the past 10 years.
2016
Upper confidence limit for F: 0.8
Percent exceeding 0.2 µg/m3 (F): 0.6
Lower confidence limit for F: 0.5
2017
Upper confidence limit for F: 1.3
Percent exceeding 0.2 µg/m3 (F): 1.0
Lower confidence limit for F: 0.8
2018
Upper confidence limit for F: 1.8
Percent exceeding 0.2 µg/m3 (F): 1.5
Lower confidence limit for F: 1.2
2019
Upper confidence limit for F: 1.2
Percent exceeding 0.2 µg/m3 (F): 0.9
Lower confidence limit for F: 0.7
2020
Upper confidence limit for F: 0.5
Percent exceeding 0.2 µg/m3 (F): 0.3
Lower confidence limit for F: 0.2
2021
Upper confidence limit for F: 0.4
Percent exceeding 0.2 µg/m3 (F): 0.3
Lower confidence limit for F: 0.2
2022
Upper confidence limit for F: 0.4
Percent exceeding 0.2 µg/m3 (F): 0.3
Lower confidence limit for F: 0.2
2023
Upper confidence limit for F: 0.7
Percent exceeding 0.2 µg/m3 (F): 0.5
Lower confidence limit for F: 0.3
2024
Upper confidence limit for F: 1.0
Percent exceeding 0.2 µg/m3 (F): 0.8
Lower confidence limit for F: 0.6
2025
Upper confidence limit for F: 0.1
Percent exceeding 0.2 µg/m3 (F): 0.1
Lower confidence limit for F: 0.0
Exceedances Observed through 2025
-
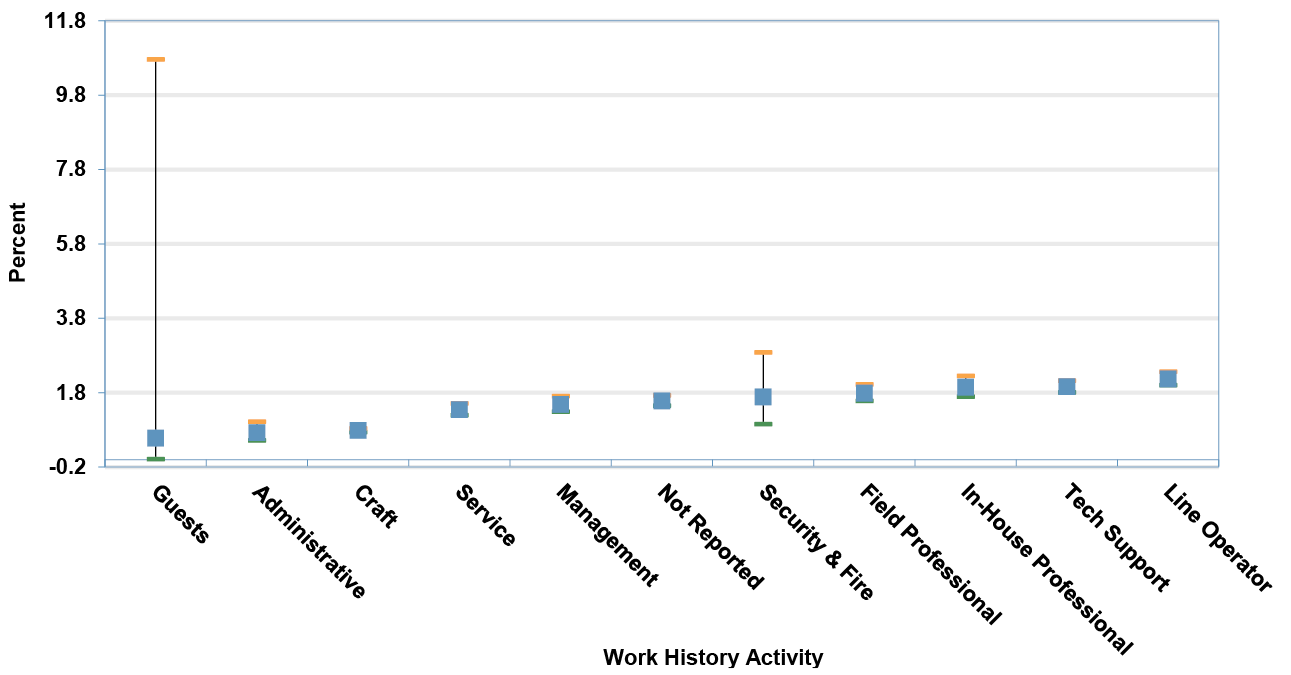
Percent of 8-hour time weighted average (TWA) Exceeding Action Level 0.2 µg/m3 by Work History Activity (2002-2025) *
Mouse over or click a data point to view additional information.
* Some reporting organizations have provided data that predate the 2002 start date of the registry. Percent exceeding 0.2 μg/m3 based on 95% Confidence Limits.
The graphic shows the percentage of 8-hour time weighted average (TWA) exposure monitoring results that exceed the action level, grouped by work activity for the cumulative data through CY2025. The detailed data in the table provide additional summary statistics for the composite 8-hour TWA results by work activity.
For the cumulative data, the highest percentage of action level exceedances by work history activity is among workers where the work activity is unknown or not reported.
Summary Statistics for 8-hour time weighted average (TWA) Exceeding Action Level 0.2 μg/m 3 by Work History Activity (2002-2025)* Work History Activity Admin. Craft Field Prof. Guests In-house Prof. Line Operator Management Security & Fire Service Tech Support Not Reported Total No. reported monitoring results 1,804 (1.4%) 54.914 (43.2%) 418 (0.3%) 6.845 (5.4%) 45 (0.0%) 4,735 (3.7%) 6,077 (4.8%) 15,931 (12.5%) 12,104 (9.5%) 9,746 (7.7%) 14,572 (11.5%) 127,191 (100%) No. detected values 62 (0.6%) 2,664 (27%) 17 (0.2%) 688 (7%) 11 (0.1%) 511 (5.2%) 513 (5.2%) 1,923 (19.5%) 1,158 (11.7%) 653 (6.6%) 1,671 (16.9%) 9,871 (100%) % non-detects 96.7 95.1 96.3 90.3 82.4 88.5 91.1 83.1 90.5 93.2 87.9 91.9 No. individuals monitored 111 (1.2%) 2,992 (31.5%) 107 (1.1%) 826 (8.7%) 7 (0.1%) 384 (4.0%) 377 (4.0%) 1,859 (19.6%) 1,442 (15.2%) 918 (9.7%) 1,532 (16.1%) 9,491 (100%) Observed 95th percentile of data (µg/m 3) <0.01 0.008 0.001 0.034 0.019 0.046 0.021 0.063 0.050 0.016 0.050 0.021 95% UTL of 95th percentile (µg/m 3) 0.038 0.050 0.050 0.058 NA 0.053 0.050 0.082 0.096 0.050 0.080 0.050 Largest value (µg/m 3) 28.475 84.933 11.700 26.678 0.172 12.611 87.419 7.670 575.930 79.330 29.852 575.930 % > 0.2 µg/m 3 (F) 1.0 0.8 1.7 1.7 0.4 2.0 1.3 1.9 2.2 1.3 1.9 1.4 Lower confidence limit for F 0.7 0.8 0.9 1.5 <0.1 1.7 1.1 1.7 2.0 1.2 1.8 1.3 Upper confidence limit for F 1.3 0.9 2.9 1.9 3.6 2.2 1.5 2.0 2.4 1.5 2.1 1.4 *Some reporting organizations have provided data that predate the 2002 start date of the registry. Percent exceeding 0.2 μg/m3 based on 95% Confidence Limits.
Guests
Upper confidence limit for F: 1.9
Percent exceeding 0.2 µg/m3 (F): 1.7
Lower confidence limit for F: 1.5
Administrative
Upper confidence limit for F: 1.3
Percent exceeding 0.2 µg/m3 (F): 1.0
Lower confidence limit for F: 0.7
Craft
Upper confidence limit for F: 0.9
Percent exceeding 0.2 µg/m3 (F): 0.8
Lower confidence limit for F: 0.8
Service
Upper confidence limit for F: 2.4
Percent exceeding 0.2 µg/m3 (F): 2.2
Lower confidence limit for F: 2.0
Management
Upper confidence limit for F: 1.5
Percent exceeding 0.2 µg/m3 (F): 1.3
Lower confidence limit for F: 1.1
Not Reported
Upper confidence limit for F: 2.1
Percent exceeding 0.2 µg/m3 (F): 1.9
Lower confidence limit for F: 1.8
Security & Fire
Upper confidence limit for F: 2.0
Percent exceeding 0.2 µg/m3 (F): 1.9
Lower confidence limit for F: 1.8
Field Professional
Upper confidence limit for F: 2.9
Percent exceeding 0.2 µg/m3 (F): 1.7
Lower confidence limit for F: 0.9
In-House Professional
Upper confidence limit for F: 3.6
Percent exceeding 0.2 µg/m3 (F): 0.4
Lower confidence limit for F: <0.1
Tech Support
Upper confidence limit for F: 1.5
Percent exceeding 0.2 µg/m3 (F): 1.3
Lower confidence limit for F: 1.2
Line Operator
Upper confidence limit for F: 2.2
Percent exceeding 0.2 µg/m3 (F): 2.0
Lower confidence limit for F: 1.7
-
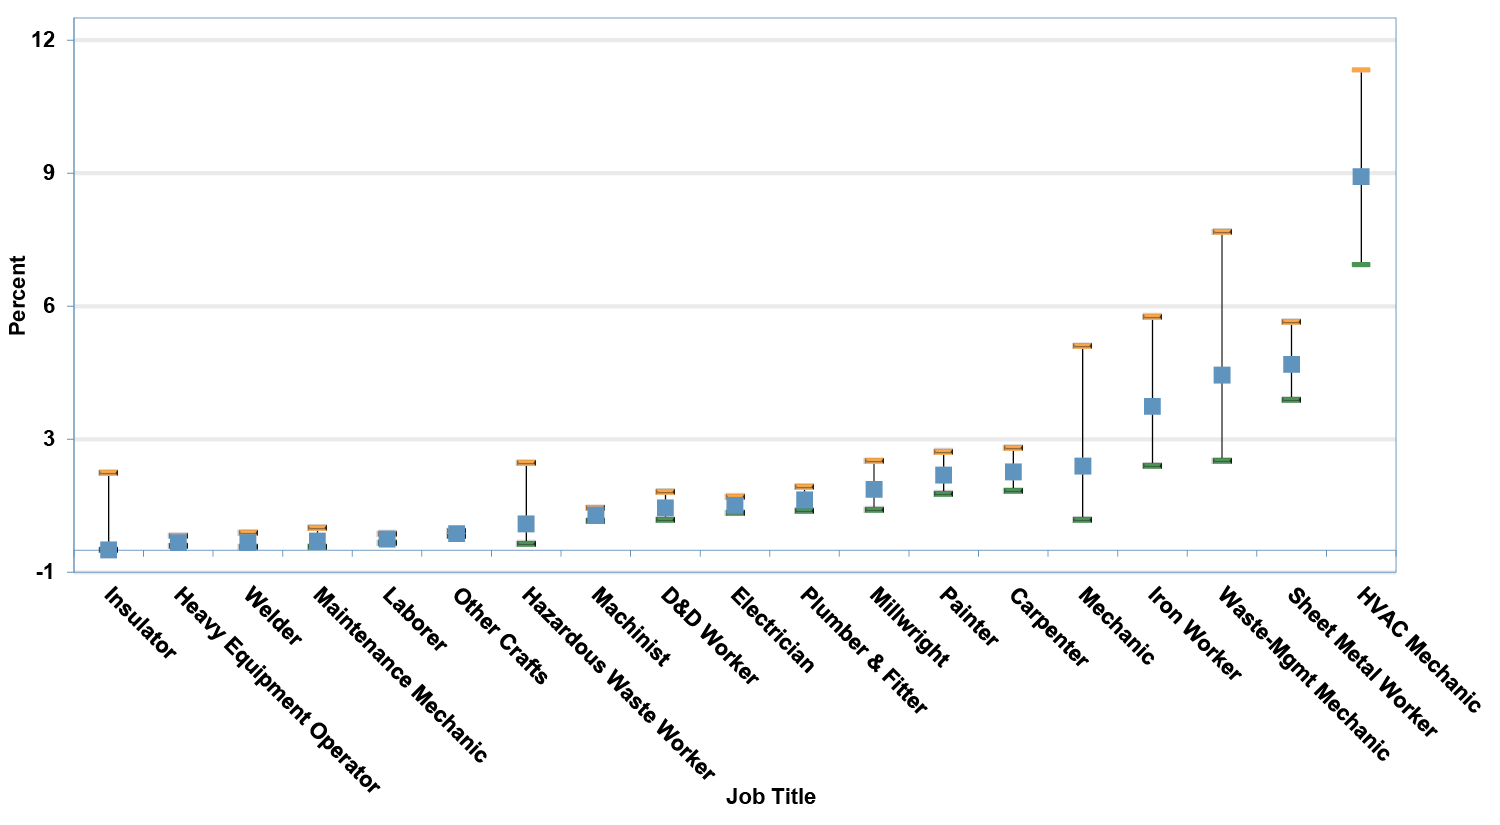
Percent of 8-hour time weighted average (TWA) Exceeding Action Level 0.2 µg/m3 by Job Title for Craft Workers (2002–2025) *
Mouse over or click a data point to view additional information.
This graphic shows individuals with job titles in the craft work activity category and is highlighted because it represents the largest occupational category in BAWR. The detailed data through 2025 presented in the accompanying table include the summary statistics for cumulative 8-hour TWA monitoring results by craft job title. Machinist, Deactivation & Decommissioning (D&D Worker), Electrician, Plumber & Fitter, Millwright, Painter, Carpenter, Mechanic, Iron Worker, Waste-Management Mechanic, Sheet Metal Worker, and Heating, Ventilation, and Air Conditioning (HVAC) Mechanic individually have percent exceedances that are higher than when all crafts are combined (0.8% to 8.4% as compared to 0.7%, as shown in the table below).
Among craft workers, HVAC Mechanic, Sheet Metal Worker, Iron Worker, Waste-Management Mechanic, and Mechanic show percentages exceeding the 0.2 µg/m3 action level that are higher than the percentages experienced by other craft workers. However, the percentage for HVAC mechanics reflects exposure monitoring results for only 45 individuals, and for sheet metal workers only 146 individuals.
Summary Statistics for 8-hour time weighted average (TWA) Exceeding Action Level 0.2 µg/m 3 by Job Title (2002-2025)* Craft Job Title Number of reported monitoring results Number of detected values Percent non-detects Number of individuals monitored Observed 95th% of data (µg/m 3) 95% UTL of 95th% (µg/m 3) Largest value (µg/m 3) Percent exceeding 0.2 µg/m 3 (F) Lower confidence limit for F Upper confidence limit for F Insulator 171 (0%) 1 (0%) 99.4 29 (1%) 0.20 <0.01 20 <0.01 <0.01 1.7 Heavy Equip Operator 1,465 (3%) 66 (2%) 95.5 161 (5%) <0.01 0.02 12.45 0.2 0.1 0.3 Welder 1,211 (2%) 31 (1%) 97.4 58 (2%) 0.01 0.02 0.36 0.2 0.1 0.4 Maintenance Mechanic 803 (1%) 19 (1%) 97.6 127 (4%) <0.01 0.03 0.20 0.2 0.1 0.5 Laborer 4,055 (7%) 80 (3%) 98.0 444 (15%) <0.01 0.04 10.34 0.2 0.2 0.4 Other Crafts 24,932 (45%) 716 (27%) 97.1 576 (19%) <0.01 0.02 37.30 0.4 0.3 0.4 Hazardous Waste Worker 277 (1%) 7 (0%) 97.5 31 (1%) <0.01 0.15 0.18 0.6 0.1 2.0 Machinist 7,069 (13%) 321 (12%) 95.5 135 (5%) 0.01 0.05 51.89 0.8 0.7 0.9 D&D Worker 1,536 (3%) 160 (6%) 89.6 29 (1%) 0.03 0.04 2.90 0.9 0.7 1.3 Electrician 4,876 (9%) 369 (14%) 92.4 474 (16%) 0.02 0.05 14.42 1.0 0.8 1.2 Plumber & Fitter 2,988 (5%) 181 (7%) 93.9 311 (10%) 0.01 0.05 5.73 1.1 0.9 1.4 Millwright 931 (2%) 49 (2%) 94.7 149 (5%) 0.01 0.05 20.18 1.4 0.9 2.0 Painter 1,389 (3%) 187 (7%) 86.5 69 (2%) 0.05 0.07 7.42 1.7 1.3 2.2 Carpenter 1,417 (3%) 131 (5%) 90.8 164 (5%) 0.04 0.05 3.18 1.8 1.3 2.3 Mechanic 132 (0%) 11 (0%) 91.7 43 (1%) 0.02 0.07 0.14 1.9 0.7 4.6 Iron Worker 236 (0%) 30 (1%) 87.3 67 (2%) 0.13 0.32 1.85 3.2 1.9 5.3 Waste-Mgmt Mechanic 132 (0%) 16 (1%) 87.9 15 (1%) 0.11 1.10 2.39 3.9 2.0 7.2 Sheet Metal Worker 989 (2%) 168 (6%) 83.0 146 (5%) 0.18 0.32 8.87 4.2 3.4 5.1 HVAC Mechanic 305 (1%) 121 (5%) 60.3 32 (1%) 0.35 0.84 6.40 8.4 6.4 10.8 All Combined Craft 54,914 (100%) 2,664 (100%) 95.1 2,992 (100%) 0.01 0.05 51.89 0.8 0.7 0.8 * Some reporting organizations have provided data that predate the 2002 start date of the registry. Percent exceeding 0.2 μg/m 3
Insulator
Upper confidence limit for F: 1.7
Percent exceeding 0.2 µg/m3 (F): <0.01
Lower confidence limit for F: <0.1
Heavy Equip Operator
Upper confidence limit for F: 0.3
Percent exceeding 0.2 µg/m3 (F): 0.2
Lower confidence limit for F: 0.1
Welder
Upper confidence limit for F: 0.4
Percent exceeding 0.2 µg/m3 (F): 0.2
Lower confidence limit for F: 0.1
Maintenance Mechanic
Upper confidence limit for F: 0.5
Percent exceeding 0.2 µg/m3 (F): 0.2
Lower confidence limit for F: 0.1
Laborer
Upper confidence limit for F: 0.4
Percent exceeding 0.2 µg/m3 (F): 0.4
Lower confidence limit for F: 0.3
Other Crafts
Upper confidence limit for F: 0.4
Percent exceeding 0.2 µg/m3 (F): 0.4
Lower confidence limit for F: 0.3
Hazardous Waste Worker
Upper confidence limit for F: 2.0
Percent exceeding 0.2 µg/m3 (F): 0.6
Lower confidence limit for F: 0.1
Machinist
Upper confidence limit for F: 0.9
Percent exceeding 0.2 µg/m3 (F): 0.8
Lower confidence limit for F: 0.7
D&D Worker
Upper confidence limit for F: 1.3
Percent exceeding 0.2 µg/m3 (F): 0.9
Lower confidence limit for F: 0.7
Electrician
Upper confidence limit for F: 1.2
Percent exceeding 0.2 µg/m3 (F): 1.0
Lower confidence limit for F: 0.8
Plumber & Fitter
Upper confidence limit for F: 1.4
Percent exceeding 0.2 µg/m3 (F): 1.1
Lower confidence limit for F: 0.9
Millwright
Upper confidence limit for F: 2.3
Percent exceeding 0.2 µg/m3 (F): 1.4
Lower confidence limit for F: 0.9
Painter
Upper confidence limit for F: 2.2
Percent exceeding 0.2 µg/m3 (F): 1.7
Lower confidence limit for F: 1.3
Carpenter
Upper confidence limit for F: 2.3
Percent exceeding 0.2 µg/m3 (F): 1.8
Lower confidence limit for F: 1.3
Mechanic
Upper confidence limit for F: 4.6
Percent exceeding 0.2 µg/m3 (F): 1.9
Lower confidence limit for F: 0.7
Iron Worker
Upper confidence limit for F: 5.3
Percent exceeding 0.2 µg/m3 (F): 3.2
Lower confidence limit for F: 1.9
Waste-Mgmt Mechanic
Upper confidence limit for F: 7.2
Percent exceeding 0.2 µg/m3 (F): 3.9
Lower confidence limit for F: 2.0
Sheet Metal Worker
Upper confidence limit for F: 5.1
Percent exceeding 0.2 µg/m3 (F): 4.2
Lower confidence limit for F: 3.4
HVAC Mechanic
Upper confidence limit for F: 10.8
Percent exceeding 0.2 µg/m3 (F): 8.4
Lower confidence limit for F: 6.4
-
Percent of 8-hour time weighted average (TWA) Exceeding Action Level 0.2 µg/m3 by Reporting Organization (2002-2025) *
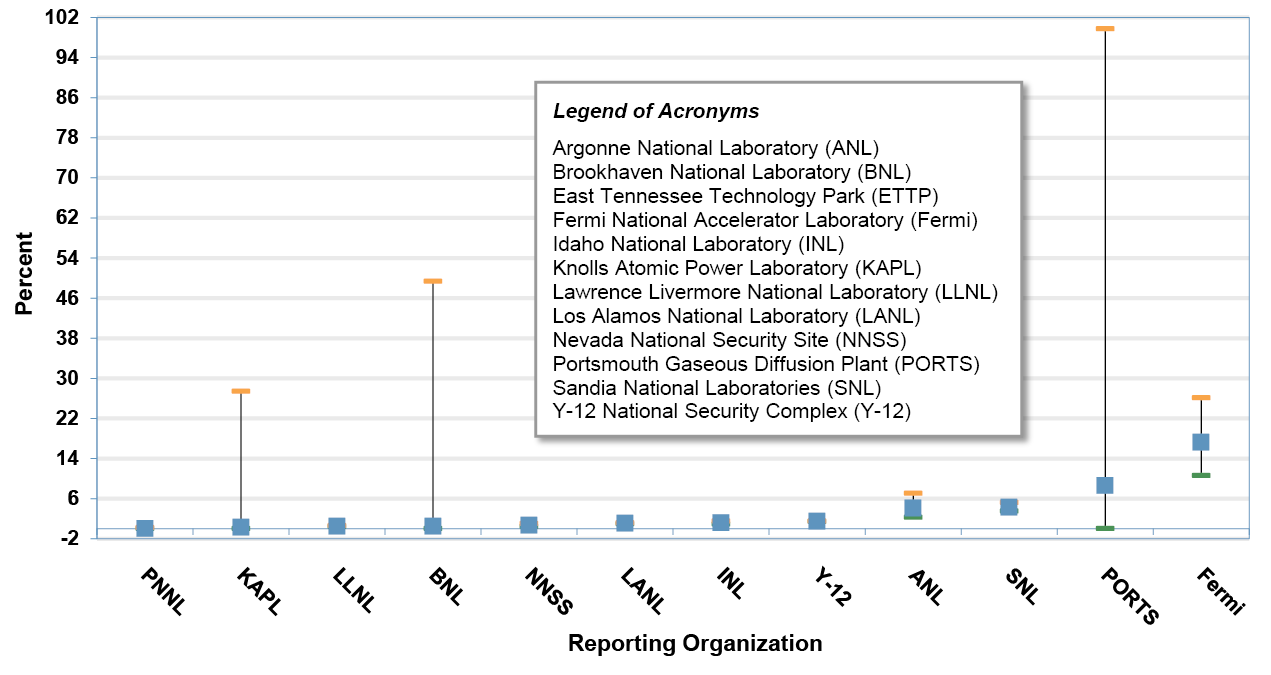
Mouse over or click a data point to view additional information.
This chart summarizes the cumulative 8-hour TWA exposure monitoring results through Calendar Year 2025 by reporting organization. The detailed data presented below include the summary statistics for the cumulative 8-hour TWA monitoring results for each reporting organization that reported workers with a percentage exceeding the exposure level. The percentage of monitoring results exceeding the action level at Y-12, ANL, SNL, PORTS, and Fermi (ranging from 1.5 to 17.2%) were higher than the overall percent exceedances when data across all organizations are combined (1.3%).
The graphic does not include results from Ames Lab, HAN, KCNSC, LANL N3B, LBNL, LLNL CHES, LLNL NW, ORNL, PADUCAH, PNNL AMC, PTX, SLAC, SRS, and Y-12 ANS because of the small number of total samples and/or low percent exceeding the action level.
Summary Statistics for 8-hour time weighted average (TWA) Exceeding Action Level 0.2 μg/m3 by Reporting Organization (2002-2024)* Reporting Organization No. monitoring results No. detected values % non-detects No. individ. monitored Obs. 95th percentile (µg/m 3) 95% UTL /95th % (µg/m 3) Largest value (µg/m 3) % > 0.2 µg/m 3 (F) Lower confidence limit for F Upper confidence limit for F Ames Lab 57 (0%) 3 (0.0%) 94.7 12 (1.7%) <0.1 < 0.1 0.028 < 0.1 < 0.1 91.1 ANL 155 (0.1%) 18 (0.2%) 88.4 2 (0.3%) 0.145 1.100 2.390 4.104 2.251 7.0 BNL 108 (0.1%) 2 (0.0%) 98.1 23 (3.2%) 0.002 0.100 0.100 0.485 < 0.1 49.3 DOE-ORO 4 (0.0%) 0 (0.0%) 100.0 8 (1.1%) 0.007 < 0.1 0.007 < 0.1 < 0.1 52.7 ETTP 234 (0.2%) 0 (0.0%) 100.0 58 (8.1%) 0.009 < 0.1 0.031 < 0.1 < 0.1 1.3 Fermi 48 (0.0%) 22 (0.2%) 54.2 1 (0.1%) 1.296 < 0.1 4.800 17.240 10.578 26.1 HAN 548 (0.4%) 0 (0.0%) 100.0 58 (8.1%) 0.003 < 0.1 0.200 < 0.1 < 0.1 0.7 INL 2,329 (1.8%) 274 (2.8%) 88.2 26 (3.6%) 0.036 0.093 2.897 1.182 0.920 1.5 KAPL 236 (0.2%) 2 (0.0%) 99.2 39 (5.4%) 0.006 0.200 0.200 0.297 < 0.1 27.4 KCNSC 6 (0.0%) 0 (0.0%) 100.0 156 (21.7%) 0.021 < 0.1 0.027 < 0.1 < 0.1 39.3 LANL 14,457 (11.4%) 2,787 (28.2%) 80.7 2 (0.3%) 0.040 0.055 26.678 1.066 0.969 1.2 LANL N3B 53 (0.0%) 1 (0.0%) 98.1 23 (3.2%) 0.014 < 0.1 0.015 < 0.1 < 0.1 5.5 LBNL 18 (0.0%) 0 (0.0%) 100.0 8 (1.1%) 0.100 < 0.1 0.100 < 0.1 < 0.1 15.3 LLNL 6,795 (5.3%) 303 (3.1%) 95.5 330 (46.0%) 0.013 0.033 5.133 0.477 0.379 0.6 LLNL CHES 3 (0.0%) 0 (0.0%) 100.0 1 (0.1%) 0.040 < 0.1 0.042 < 0.1 < 0.1 63.2 LLNL NW 2 (0.0%) 1 (0.0%) 50.0 1 (0.1%) 0.043 < 0.1 0.044 < 0.1 < 0.1 77.6 NNSS 1,129 (0.9%) 94 (1.0%) 91.7 297 (41.4%) 0.010 0.052 0.317 0.658 0.416 1.0 ORNL 36 (0.0%) 0 (0.0%) 97.2 22 (3.1%) 0.010 < 0.1 0.019 < 0.1 < 0.1 8.0 PADUCAH 90 (0.1%) 0 (0.0%) 100.0 17 (2.4%) 0.007 < 0.1 0.007 < 0.1 < 0.1 3.3 PNNL 245 (0.2%) 10 (0.1%) 95.9 62 (8.6%) 0.002 0.005 0.028 0.015 0.001 0.2 PNNL AMC 2 (0.0%) 0 (0.0%) 100.0 2 (0.3%) 0.001 < 0.1 0.001 < 0.1 < 0.1 77.6 PORTS 5 (0.0%) 2 (0.0%) 60.0 2 (0.3%) 0.376 < 0.1 0.500 8.612 < 0.1 99.7 PTX 39 (0.0%) 0 (0.0%) 100.0 24 (3.3%) 0.010 < 0.1 0.014 < 0.1 < 0.1 7.4 SLAC 42 (0.0%) 0 (0.0%) 100.0 26 (3.6%) 0.040 < 0.1 0.150 < 0.1 < 0.1 6.9 SNL 1,040 (0.8%) 392 (4.0%) 62.3 3 (0.4%) 0.130 0.180 3.820 4.279 3.512 5.2 SRS 3 (0.0%) 0 (0.0%) 100.0 1 (0.1%) 0.005 < 0.1 0.095 < 0.1 < 0.1 63.2 Y-12 70,890 (55.7%) 5,096 (51.6%) 92.8 345 (48.1%) 0.028 0.050 87.419 1.458 1.397 1.5 Y-12 ANS 1 (0.0%) 1 (0.0%) 0.0 1 (0.1%) 0.014 < 0.1 0.014 < 0.1 < 0.1 95.0 All 127,191 (100%) 9,871 (100%) 92.2 718 (100%) 0.020 0.050 575.930 1.3 1.3 1.3 Click here for List of Acronyms
* Some reporting organizations have provided data that predate the 2002 start date of the registry. Percent exceeding 0.2 μg/m 3
PNNL
Upper confidence limit for F: 0.2
Percent exceeding 0.2 µg/m3 (F): <0.1
Lower confidence limit for F: <0.1
KAPL
Upper confidence limit for F: 27.4
Percent exceeding 0.2 µg/m3 (F): 0.3
Lower confidence limit for F: < 0.1
LLNL
Upper confidence limit for F: 0.6
Percent exceeding 0.2 µg/m3 (F): 0.5
Lower confidence limit for F: 0.4
BNL
Upper confidence limit for F: 49.3
Percent exceeding 0.2 µg/m3 (F): 0.5
Lower confidence limit for F: <0.1
NNSS
Upper confidence limit for F: 1.0
Percent exceeding 0.2 µg/m3 (F): 0.7
Lower confidence limit for F: 0.4
LANL
Upper confidence limit for F: 1.2
Percent exceeding 0.2 µg/m3 (F): 1.1
Lower confidence limit for F: 1.0
INL
Upper confidence limit for F: 1.5
Percent exceeding 0.2 µg/m3 (F): 1.2
Lower confidence limit for F: 0.9
Y-12
Upper confidence limit for F: 1.5
Percent exceeding 0.2 µg/m3 (F): 1.5
Lower confidence limit for F: 1.4
ANL
Upper confidence limit for F: 7.0
Percent exceeding 0.2 µg/m3 (F): 4.1
Lower confidence limit for F: 2.3
SNL
Upper confidence limit for F: 5.2
Percent exceeding 0.2 µg/m3 (F): 4.3
Lower confidence limit for F: 3.5
PORTS
Upper confidence limit for F: 99.7
Percent exceeding 0.2 µg/m3 (F): 8.6
Lower confidence limit for F: < 0.1
Fermi
Upper confidence limit for F: 26.1
Percent exceeding 0.2 µg/m3 (F): 17.2
Lower confidence limit for F: 10.6
-
Exposure Monitoring Results Exceeding Action Level 0.2 µg/m3 by Reporting Organization (2025) *
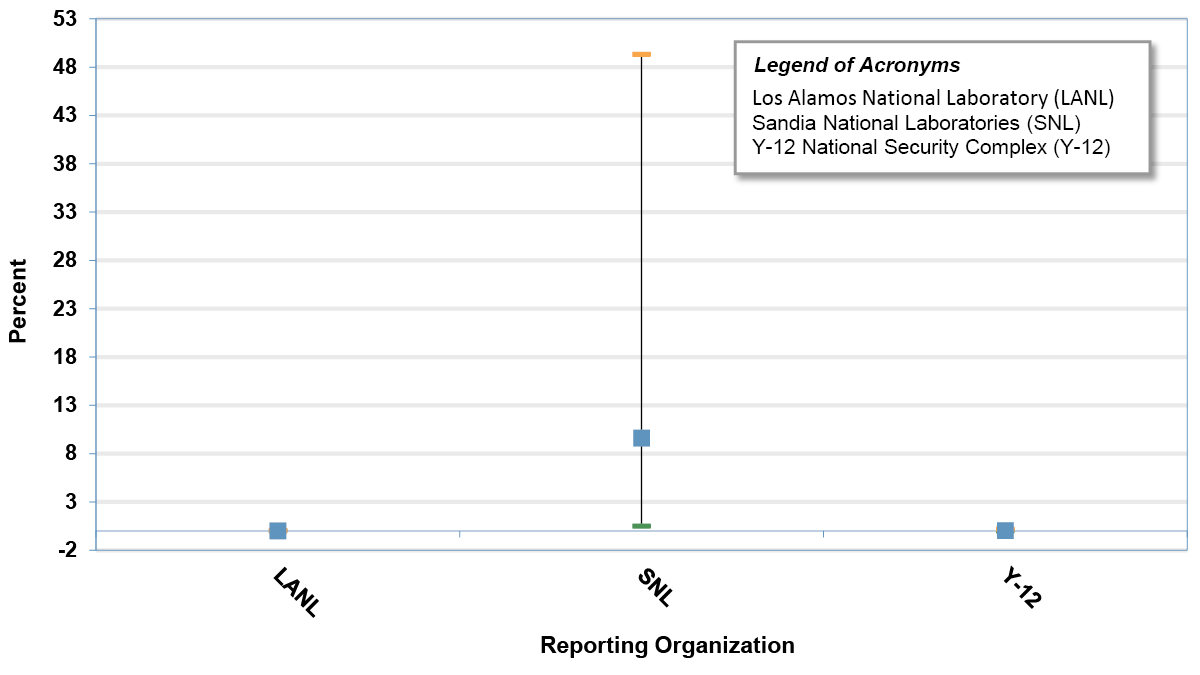
Mouse over or click a data point to view additional information.
This graphic provides the percent of exposure monitoring results that exceeded the action level by reporting organization for Calendar Year 2025 (CY2025). Fewer organizations reported exposure monitoring in recent years, and those organizations submitting data have also reported fewer sampling results. This downward trend impacts the analysis and interpretation of results in the Beryllium-Associated Worker Registry (BAWR). The small sample size reduces accuracy and causes higher variability in the statistical models used. Certainly, the wide confidence intervals in the single year CY2025 analysis demonstrate the reduction of statistical power and confidence in the interpretation when compared to similar but larger samples of the population.
The table below gives additional summary statistics for organizations reporting exposure data to the BAWR during CY2025. Organizations that did not report data for CY2025 are not included in this table.
The data in the graphic and table show that SNL (had the greatest percentage (4.9%) of reported exposure monitoring results exceeding the action level in CY2025.
Summary Statistics for Exposure Monitoring Results Exceeding Action Level 0.2 μg/m3 by Reporting Organization (2025)* Reporting Organization No. monitoring results No. detected values % non-detects No. individ. monitored Obs. 95th percentile (µg/m3) 95% UTL /95th% (µg/m3) Largest value (µg/m3) % > 0.2 µg/m3 (F) Lower confidence limit for F Upper confidence limit for F ETTP 234 (9%) 0 (0%) 100 58 (8%) HAN 465 (18%) 0 (0%) 100 156 (21%) KCNSC 6 (0%) 0 (0%) 100 2 (0%) LANL 218 (9%) 50 (70%) 77.1 83 (11%) 0.008 0.132 0.170 0.0 0.0 0.0 LLNL 10 (0%) 0 (0%) 100 8 (100%) NNSS 24 (1%) 0 (0%) 100 9 (0%) ORNL 36 (1%) 0 (0%) 100 22 (1%) PADUCAH 90 (4%) 0 (0%) 100 17 (1%) PNNL 8 (0%) 0 (0%) 100 6 (3%) PNNL AMC 2 (0%) 0 (0%) 100 2 (2%) PNNL DGR 1 (0%) 0 (0%) 100 1 (1%) PTX 39 (2%) 0 (0%) 100 24 (0%) SNL 7 (0%) 4 (6%) 42.9 7 (0%) 0.119 < 0.1 0.130 9.6 0.5 49.3 SRS 3 (0%) 0 (0%) 100 3 (3%) Y-12 1,357 (53%) 16 (23%) 98.8 345 (1%) 0.007 0.009 0.199 0.0 0.0 0.2 Y-12 ANS 37 (1%) 1 (1%) 100 11 (0%) All 2,537 (100%) 71 (100%) 97.1 754 (46%) 0.008 0.009 0.200 0.1 0.0 0.1 Click here for List of Acronyms
* Some reporting organizations have provided data that predate the 2002 start date of the registry. Percent exceeding 0.2 μg/m3 based on 95% Confidence Limits
LANL
Upper confidence limit for F: 0.04
Percent exceeding 0.2 µg/m3 (F): < 0.1
Lower confidence limit for F: < 0.1
SNL
Upper confidence limit for F: 49.30
Percent exceeding 0.2 µg/m3 (F): 9.60
Lower confidence limit for F: 0.50
Y-12
Upper confidence limit for F: 0.18
Percent exceeding 0.2 µg/m3 (F): 0.04
Lower confidence limit for F: 0.01
-
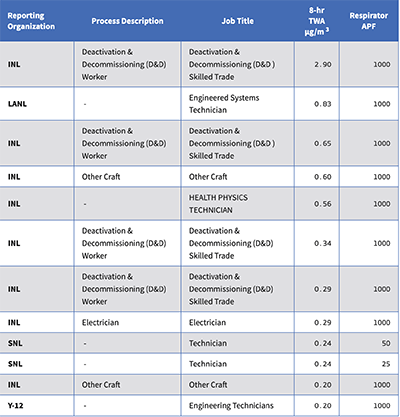
Exposure Monitoring Results Exceeding Action Level 0.2 µg/m3 by Reporting Organization (2025)

This table provides the reporting organization, process description, 8-hour time-weighted average (TWA), and the respirator assigned protection factor (APF) for the results observed above the action level through Calendar Year 2025 (CY2025).
There were fewer exceedances for CY2025 compared to CY2024 with four (4) samples exceeding the action level in CY2025, compared with 30 in CY2024, and 15 in CY2023. Since the total reported exposure sampling results continue to decrease over time, the proportion of exceedances is greater than in previous years.
Reporting Organization Process Description Job Title 8-hr TWA µg/m 3 Respirator APF HAN RO50 0.200 100 HAN Light Vehicle Drivers 0.200 100 HAN RO50 0.200 100 HAN Light Vehicle Drivers 0.200 100
Click here for List of Acronyms
* Percent exceeding 0.2 μg/m 3 based on 95% Confidence Limits.
-
Exposure Monitoring Results Exceeding Action Level 0.2 µg/m3 by Reporting Organization (2024)
This table provides the reporting organization, process description, 8-hour time-weighted average (TWA), and the respirator assigned protection factor (APF) for the results observed above the action level through Calendar Year 2024 (CY2024). Of note, 15 new exceedances were added to the CY2025 dashboard as new data was submitted to the Registry.
There were more exceedances for CY2024 compared to CY2023 with thirty (30) samples exceeding the action level in CY2024, compared with 15 in CY2023, and 12 in CY2022. Since the total reported exposure sampling results continue to decrease over time, the proportion of exceedances is greater than in previous years.
Reporting Organization Process Description Job Title 8-hr TWA µg/m 3 Respirator APF Y-12 Machine Cleaner Janitors and Cleaners 16.368 1,000 Y-12 Machine Cleaner 16.368 1,000 LANL Sheet Metal Worker Sheet Metal Worker 8.700 1,000 Y-12 Maintenance Machinist 5.734 1,000 Y-12 Assemblyperson 5.734 1,000 Y-12 Outside Machinist 2.987 1,000 Y-12 Outside Machinst 2.987 1,000 Y-12 Assemblyperson 2.648 1,000 Y-12 Maintenance Machinist 2.648 1,000 Y-12 Carpenter 1.093 1,000 Y-12 System Health Lead - UPF 1.093 1,000 Y-12 Assemblyperson 0.888 1,000 Y-12 Maintenance Machinist 0.888 1,000 Y-12 System Health Lead - UPF 0.817 1,000 Y-12 Carpenter 0.817 1,000 Y-12 System Health Lead - UPF 0.638 1,000 Y-12 Carpenter 0.638 1,000 Y-12 Carpenter 0.598 1,000 Y-12 System Health Lead - UPF 0.598 1,000 Y-12 Outside Machinist 0.503 1,000 Y-12 Outside Machinist 0.503 1,000 Y-12 Assemblyperson 0.356 1,000 Y-12 Machine Cleaner 0.356 1,000 Y-12 Outside Machinist 0.319 1,000 Y-12 Outside Machinist Machinists 0.319 1,000 Y-12 Carpenter 0.259 1,000 Y-12 System Health Lead - UPF 0.259 1,000 ETTP Characterization 0.250 1,000 HAN Industrial Hygienists 0.200 HAN Industrial Hygienists 0.200
Click here for List of Acronyms
* Percent exceeding 0.2 μg/m 3 based on 95% Confidence Limits.
-
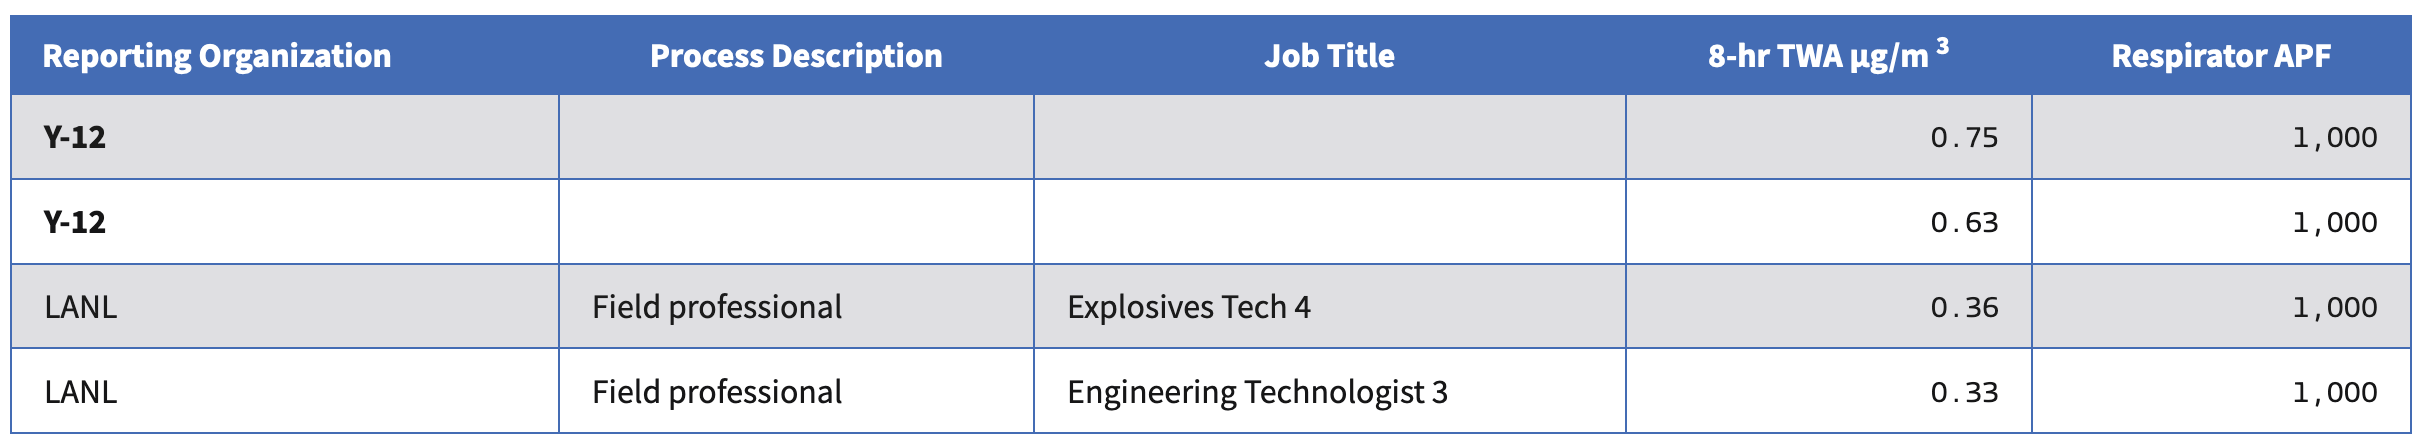
Exposure Monitoring Results Exceeding Action Level 0.2 µg/m3 by Reporting Organization (2023)
This table provides the reporting organization, process description, 8-hour time-weighted average (TWA), and the respirator assigned protection factor (APF) for the results observed above the action level through Calendar Year 2023 (CY2023).
There were more exceedances in CY2023 compared to CY2022 with fifteen (15) samples exceeding the action level in CY2023, compared with 12 in CY2022, and 12 in CY2021. Since the total reported exposure sampling results continue to decrease over time, the proportion of exceedances is greater than in previous years.
Reporting Organization Process Description Job Title 8-hr TWA µg/m 3 Respirator APF Y-12 Outside Machinist Machinists 37.536 1,000 Y-12 Assemblyperson 25.982 1,000 Y-12 Carpenter 1.921 1,000 Y-12 Outside Machinist 1.667 1,000 Y-12 Carpenter Carpenters 1.234 1,000 Y-12 Carpenter 1.113 1,000 Y-12 Carpenter Carpenters 0.754 1,000 Y-12 Carpenter Carpenters 0.754 1,000 Y-12 Assemblyperson 0.656 1,000 Y-12 Carpenter Carpenters 0.626 1,000 Y-12 Carpenter Carpenters 0.626 1,000 Y-12 Pipefitter Plumbers and Pipefitters 0.501 1,000 LANL Research Technologist 1 Research Technologist 1 0.356 1,000 LANL Engineering Technologist 3 Engineering Technologiist 3 0.330 1,000 Y-12 Outside Machinist Machinists 0.229 1,000
Click here for List of Acronyms
* Percent exceeding 0.2 μg/m 3 based on 95% Confidence Limits.
Health and Monitoring Comparisons
Two different reporting organization groups collect data associated with health monitoring and exposure monitoring. Occupational health and medical groups collect health monitoring data and industrial hygiene groups collect exposure monitoring data. In most cases, a data coordinator collates the data prior to submission to the Registry. In this section, the health screening data compared to the exposure monitoring data provides insight on the effectiveness of coordination between the 2 activities.
-
Comparison of the Number and Percent Proportion for Beryllium-Associated Workers Diagnosed with BeS or CBD with and without Exposure Sampling Results by Reporting Organizations (n=718) (2002-2025) *
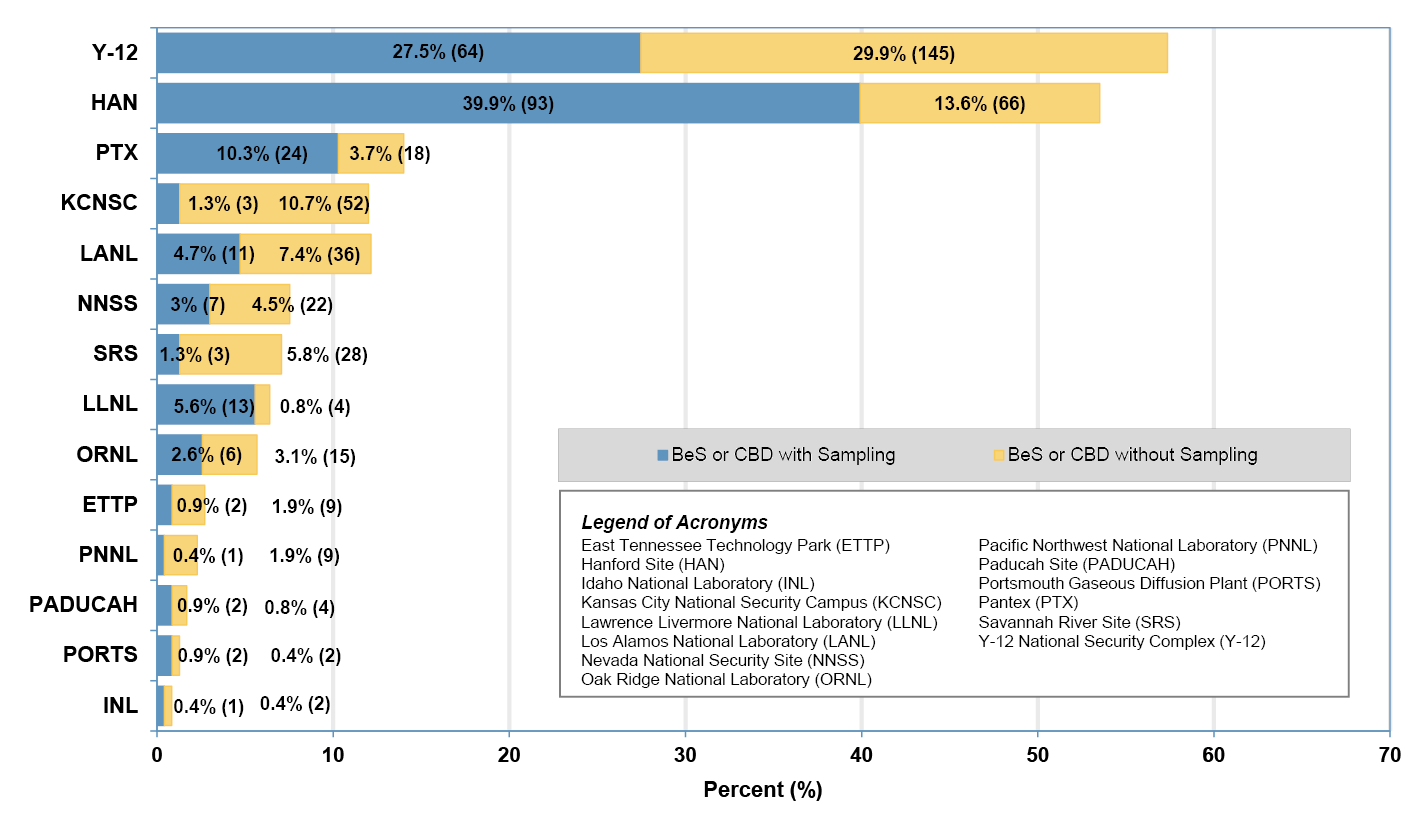
The data in the figure shows the collective number of Beryllium Sensitized (BeS) or Chronic Beryllium Disease (CBD) individuals through Calendar Year 2025 who have had exposure monitoring results submitted to the Registry. The figure also illustrates the collective number of individuals who have not had exposure data submitted to the Registry. A combined 68% of the workers identified as either BeS or CBD do not have exposure monitoring results submitted to the Registry. Thirty-three percent of workers (182 of 561) identified as BeS and 32% of workers (84 of 157) identified as CBD have exposure monitoring results submitted to the Registry. The combined proportion of workers without exposure data in the annual summaries since 2016 averaged 68% (10-year average).
Of the 182 sensitization cases with exposure sampling data, 118 cases only had exposure sampling data with a monitoring date later than their reported date of BeS. In other words, 65% of the BeS cases with exposure data had exposure monitoring initiated only after diagnosed as sensitized.
Of the 157 workers reported as diagnosed with CBD, 51 (32%) of the cases had at least one exposure sampling measurement submitted to the Registry. Industrial hygiene programs monitor workers diagnosed with CBD to ensure compliance with restricted duty. Nevertheless, of the 157 workers with CBD, only 35 (22%) CBD cases had at least one reported exposure record dated later than their date of CBD diagnosis. Of those 35 cases, 17 workers had exposure monitoring initiated only after diagnosed as CBD.
* Some reporting organizations have provided data that predate the 2002 start date of the registry.
-
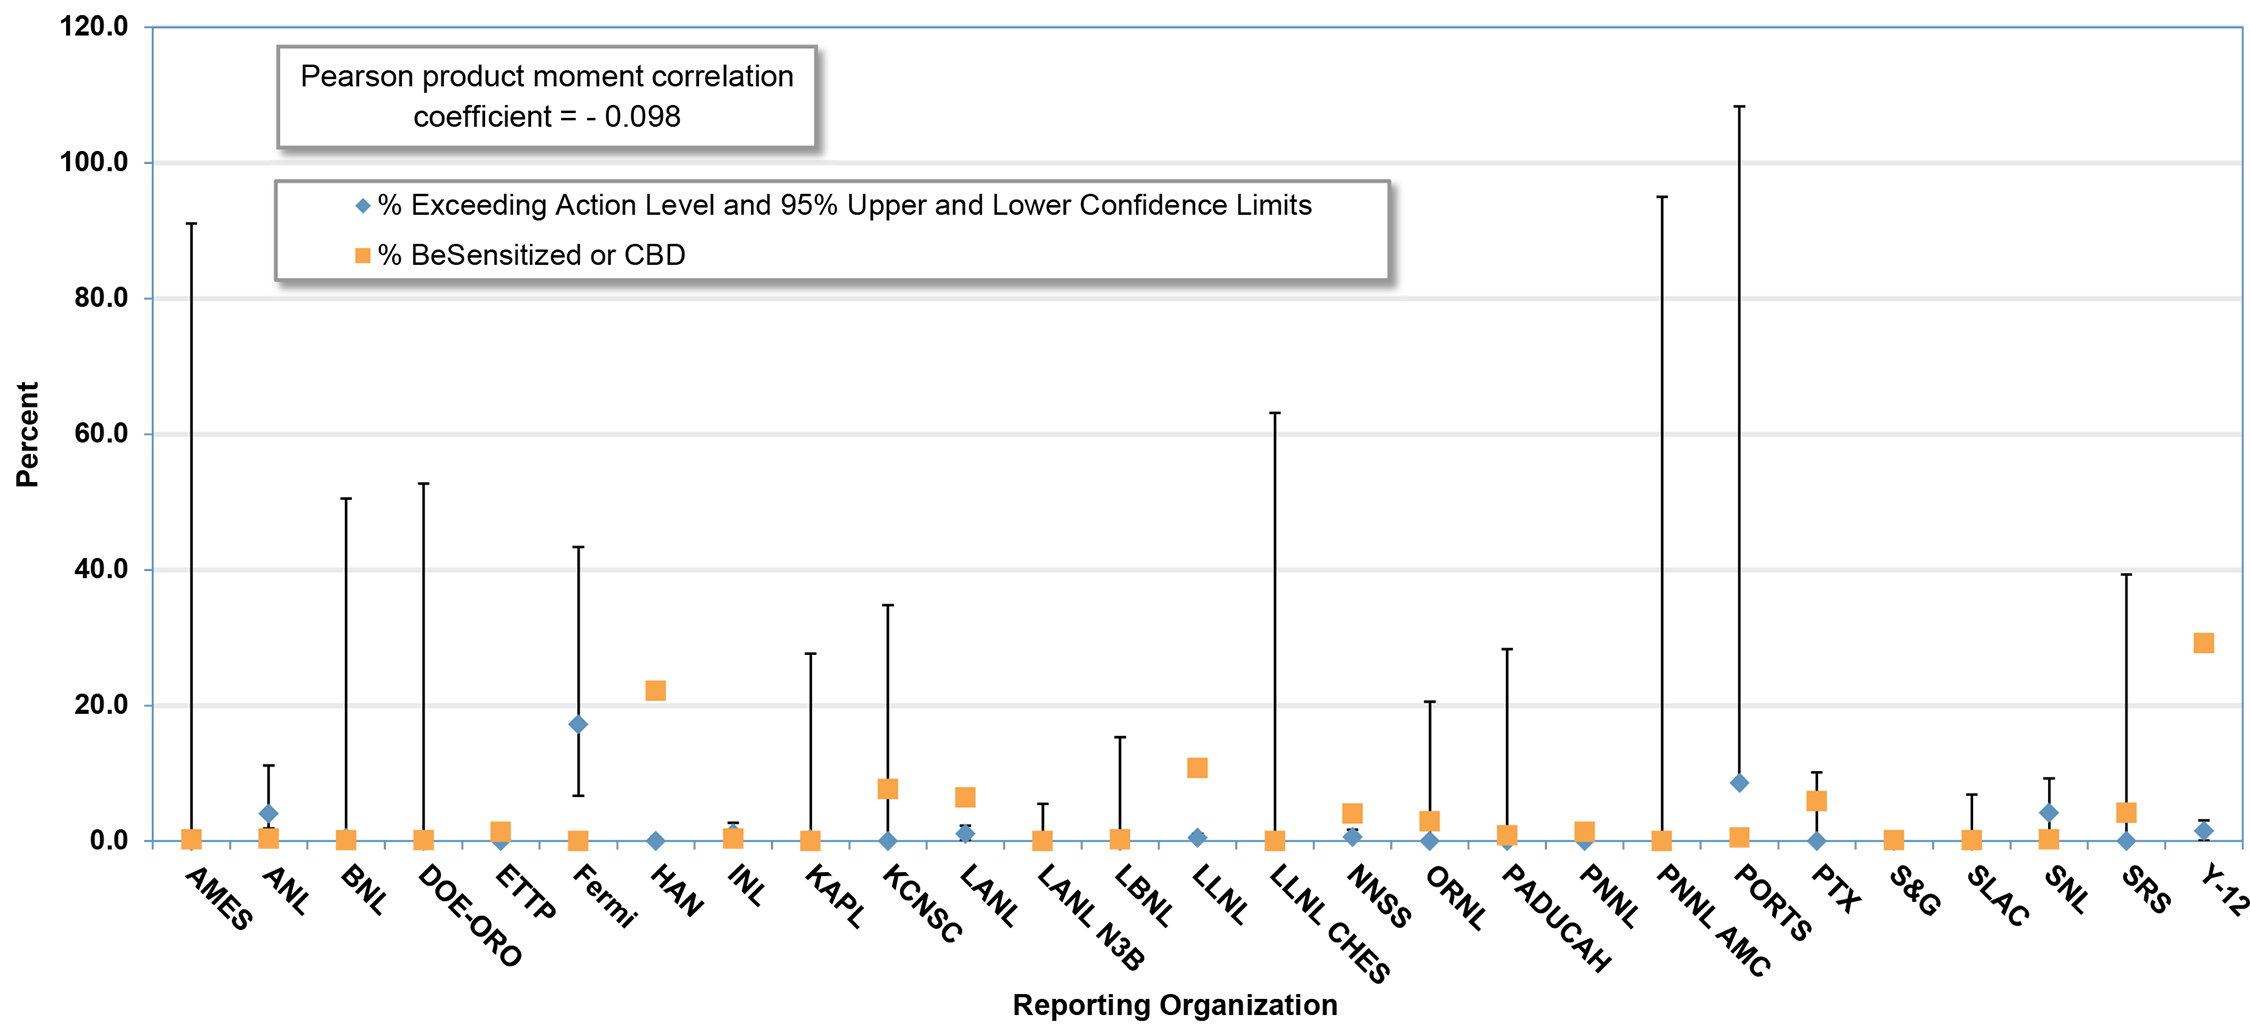
Comparison of the Percent of Workers Diagnosed with BeS or CBD with Percent Exceeding Action Level 0.2 μg/m3 by Reporting Organization (2002-2025) *
Click here for List of Acronyms
* Some reporting organizations have provided data that predate the 2002 start date of the registry. Percent exceeding 0.2 µg/m3 based on 95% Confidence Limits.
The figure compares the cumulative percentage of workers diagnosed as beryllium-sensitized (BeS) or with chronic beryllium disease (CBD) to the percentage of exposure samples exceeding the 0.2 µg/m3 action level for each reporting agency. These data illustrate that no statistical correlation exists between the incidence of BeS/CBD and the percentage of exceedances among the exposure sampling results submitted to the Registry (Pearson product moment correlation coefficient = -0.122). The lack of correlation could be due to sensitization and CBD cases associated with past work locations or conditions rather than the environment currently monitored.