
2024 Summary
Executive Summary
The U.S. Department of Energy (DOE) Office of Environment, Health, Safety and Security (EHSS) publishes annual occupational radiation exposure reports to provide DOE Management, Program Offices, workers, health physicists, and other stakeholders an evaluation of DOE-wide performance regarding compliance with Title 10 of the Code of Federal Regulations (CFR) Part 835, Occupational Radiation Protection (10 CFR 835) radiation exposure limits and adherence to as low as reasonably achievable (ALARA) principles.
This report presents the results of analyses of occupational radiation exposures at DOE operations, including the National Nuclear Security Administration (NNSA), during calendar year (CY) 2024. The report includes occupational radiation exposure information for over 84,000 DOE Federal employees, contractors, and subcontractors, and members of the public monitored for radiation exposure. The 97 DOE organizations that submitted radiation exposure reports in CY 2024 have been grouped into 33 sites. The information has been analyzed to provide a measure of DOE’s performance in protecting workers and individuals who have entered controlled areas.
Individuals who have the potential to be exposed to radiation at a DOE facility are required to be monitored in accordance with 10 CFR 835, Subpart E. The exposure monitoring data are used to determine the radiation dose received by the individual, which is reported to DOE through the DOE Radiation Exposure Monitoring System (REMS) in accordance with DOE Order 231.1B Admin Chg 1, Environment, Safety and Health Reporting.
Unless otherwise specified, the term “dose” used in this report refers to the total effective dose (TED) and is measured in units of “rem” (derived from the phrase Roentgen equivalent man). The sievert (Sv) is the international unit of effective dose, where 1 Sv is equal to 100 rem and 1 rem is, therefore, equal to 10 millisieverts (mSv). TED is the summation of the effective dose from sources of radiation that are external and internal to the body. The committed effective dose (CED) is the dose resulting from radioactive material taken into the body and is commonly referred to as internal dose. The term “collective dose” is the sum of the individual doses received by a group of individuals and is shown in units of “person-rem.”
Analysis of the collected exposure data for CY 2024 indicates that:
- DOE operations were compliant with regulatory radiation protection requirements, as no exposures were reported to have exceeded the occupational dose limit of 5 rem (50 mSv) TED; and
- Only 19 percent of the monitored individuals received a measurable dose (a detectable dose greater than zero), and, of those, the average measurable dose received was 1 percent of the 5 rem (50 mSv) TED limit.
In addition, from CY 2023 to CY 2024:
- The collective TED decreased by 2 percent to 926.8 person-rem (9,268 person-mSv);
- The number of individuals with measurable dose decreased by 12 percent from 18,473 individuals to 16,308 individuals;
- Collective CED (internal exposure) increased by 4 percent to 43.2 person-rem (432 person-mSv); and
- Collective TED for transient individuals decreased by 27 percent to 21.6 person-rem (216 person-mSv).
The collective dose at DOE facilities has decreased by 89 percent since CY 1986. This coincides with the end of the Cold War era, which shifted the DOE mission from weapons production to stabilization, waste management, and environmental remediation activities, along with the consolidation and remediation of facilities across the complex to meet the new mission.
In alignment with the change in mission, regulations and requirements have been modified (see Section 2) that reinforce DOE’s focus on ALARA practices and risk reduction to lower occupational radiation dose.
Over the past 5 years, only one monitored individual, at Los Alamos National Laboratory (LANL), received a dose above the 2 rem (20 mSv) TED administrative control level [1].
- In CY 2020, an individual received a TED of 3.0 rem (30 mSv) after an airborne release of radioactive material. The individual received an internal dose during the incident in which skin contamination and positive nasal smears were detected. The source of the contamination was determined to be a breach of a protective glove inside a glovebox.
Details of this incident are available in the occurrence report NA--LASO-LANL-TA55-2020.
This report and other information regarding DOE occupational radiation exposure may be accessed at:
DOE Complex Wide
The U.S. Department of Energy Occupational Radiation Exposure Report for Calendar 2024 presents the results of analyses of occupational radiation exposures at the U.S. Department of Energy (DOE), including the National Nuclear Security Administration (NNSA) operations, during calendar year 2024. This report includes occupational radiation exposure data for over 84,000 DOE Federal employees, contractors, and subcontractors, as well as members of the public who have worked in or entered controlled areas monitored for exposure to radiation.
-
Components of TED
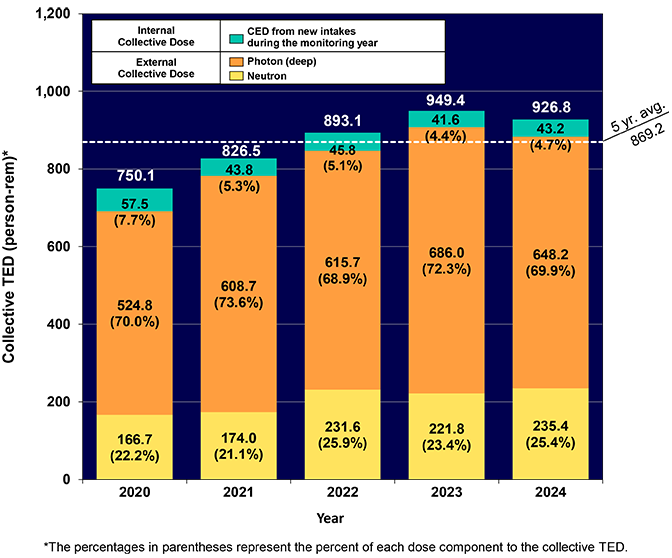
Note: roll over the yearly bar for internal and external collective dose breakdown of the sites. - The collective TED decreased by 2 percent from 949.4 person-rem (9,494 person-mSv) in CY 2023 to 926.8 person‑rem (9,268 person-mSv) in CY 2024, with LANL, Savannah River, Oak Ridge, Idaho, and Hanford contributing 86 percent of the total DOE collective TED.
- The internal dose component of the collective TED increased by 4 percent from 41.6 person‑rem (416 person‑mSv) in CY 2023 to 43.2 person‑rem (432 person‑mSv) in CY 2024 due to an increase at the Oak Ridge Y-12 National Security Complex.
- The collective photon dose decreased by 6 percent from 686.0 person‑rem (6,860 person‑mSv) in CY 2023 to 648.2 person-rem (6,482 person-mSv) in CY 2024 due to decreases at Savannah River Site and Hanford.
- The neutron component of the collective TED increased by 6 percent from 221.8 person‑rem (2,218 person‑mSv) in CY 2023 to 235.4 person-rem (2,354 person‑mSv) in CY 2024. The increase in CY 2024 resulted primarily from an increase in collective neutron dose at Los Alamos National Lab (LANL).
- Seventeen of the 33 DOE sites reported decreases in the collective TED from the CY 2023 values, and 16 of the 33 DOE sites reported increases in the collective TED from CY 2023 values.
- The five sites that contributed most (86 percent) of the DOE collective TED in CY 2024 were (in descending order of collective TED): LANL—35 percent; Savannah River—19 percent (including Savannah River National Laboratory and Savannah River Site [SRS]); Oak Ridge—14 percent (including East Tennessee Technology Park [ETTP], Y-12, ORNL, and Oak Ridge Institute for Science and Education [ORISE]); Idaho—13 percent (including Advanced Mixed Waste Treatment Project [AMWTP], Idaho Cleanup Project [ICP], and Idaho National Laboratory [INL]); and Hanford—5 percent.
ED-Neutron by Site - 2020
Site Person-rem Percent LANL 113.91 68.98% SRS 18.807 11.39% Pantex Plant 15.295 9.26% Oak Ridge: ORNL 8.336 5.05% All Other 8.790 5.32% ED-Photon by Site - 2020
Site Person-rem Percent LANL 116.186 21.94% Pantex Plant 98.614 18.62% SRS 93.406 17.64% Idaho 78.381 14.80% Oak Ridge: ORNL 39.330 7.43% Hanford: ORP 12.863 2.43% SRNL 11.227 2.12% All Other 79.619 15.03% CED by Site - 2020
Site Person-rem Percent Oak Ridge:Y-12 50.821 90.63% LANL 2.640 4.71% UMTRA 2.329 4.15% All Other 0.288 0.51% ED-Neutron by Site - 2021
Site Person-rem Percent LANL 134.723 77.69% LLNL 17.68 10.20% Pantex 12.62 7.28% Oak Ridge: ORNL 10.36 5.97% SRS 6.11 3.52% All Other 3.645 2.10% ED-Photon by Site - 2021
Site Person-rem Percent LANL 168.265 27.74% SRS 131.704 21.71% Idaho 107.696 17.75% Oak Ridge: ORNL 43.013 7.09% Hanford: ORP 27.426 4.52% Hanford: PNNL 17.127 2.82% SRNL 14.866 2.45% Hanford: Hanford Site 13.139 2.17% Oak Ridge: Y-12 12.352 2.04% WVDP 12.145 2.00% All Other 60.957 10.05% CED by Site - 2021
Site Person-rem Percent Oak Ridge: Y-12 41.680 95.18% UMTRA Project 1.314 3.00% All Other 0.795 1.82% ED-Photon by Site - 2022
Site Person-rem Percent LANL 189.322 30.82% SRS 116.698 19.00% Idaho 82.947 13.50% ORNL 51.444 8.37% PNNL 33.264 5.42% ORP 22.539 3.67% Hanford Site 15.807 2.57% Y-12 13.281 2.16% Pantex 13.278 2.11% WVDP 12.946 2.11% All Other 50.466 8.22% ED-Neutron by Site - 2022
Site Person-rem Percent LANL 182.075 78.96% Oak Ridge: ORNL 13.93 6.04% Pantex 12.631 5.48% SRS 11.320 4.91% LLNL 8.421 3.65% All Other 3.652 1.58% CED by Site - 2022
Site Person-rem Percent Oak Ridge: Y-12 43.806 95.64% UMTRA Project 1.185 2.59% All Other 0.814 1.78% ED-Photon by Site - 2023
Site Person-rem Percent SRS 200.935 29.29% LANL 152.626 22.25% Idaho 98.488 14.36% Oak Ridge: ORNL 55.914 8.15% Hanford: Hanford Site 21.878 3.19% LLNL 20.801 3.03% Hanford: ORP 20.366 2.97% Hanford: PNNL 18.488 2.69% Pantex 16.541 2.41% SRNL 15.313 2.23% All Other 64.728 9.43% ED-Neutron by Site - 2023
Site Person-rem Percent LANL 158.763 71.59% Pantex 23.635 10.66% SRS 16.02 7.22% Oak Ridge: ORNL 10.704 4.83% LLNL 7.095 3.20% All Other 5.537 2.50% CED by Site - 2023
Site Person-rem Percent Oak Ridge: Y-12 38.757 93.25% UMTRA Project 2.346 5.64% All Other 0.460 1.11% ED-Photon by Site - 2024
Site Person-rem Percent SRS 154.216 23.79% LANL 144.468 22.29% Idaho 122.168 18.85% Oak Ridge: ORNL 64.104 9.89% LLNL 20.565 3.17% Hanford: PNNL 16.598 2.56% Hanford: ORP 14.492 2.24% Pantex 13.789 2.13% All Other 97.757 15.08% ED-Neutron by Site - 2024
Site Person-rem Percent LANL 183.118 77.78% Pantex 20.416 8.67% SRS 12.860 5.46% Oak Ridge: ORNL 8.055 3.42% All Other 10.992 4.67% CED by Site - 2024
Site Person-rem Percent Oak Ridge: Y-12 41.853 96.78% All Other 1.392 3.22% -
Collective CED by Radionuclide
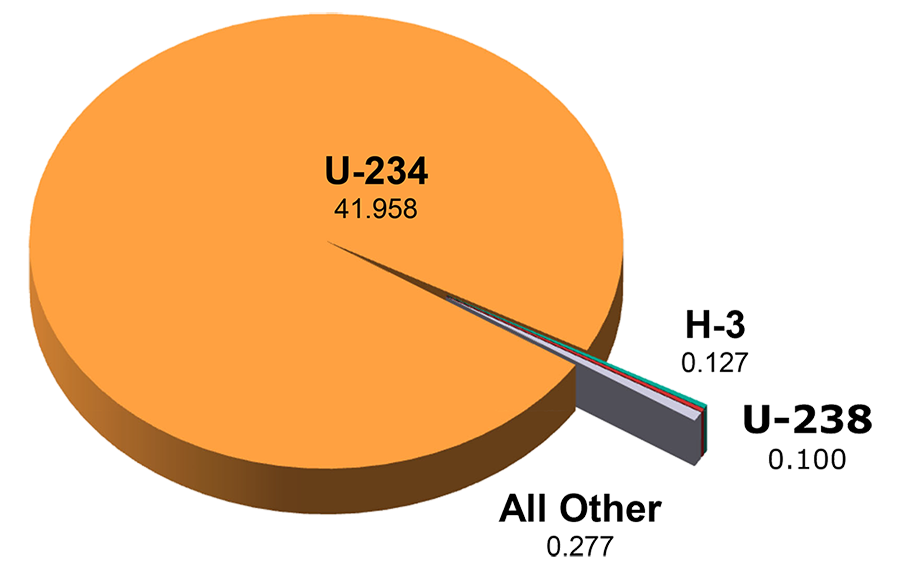
Note: roll over the radionuclide for additional information regarding collective CED. - Uranium-234 (U‑234) accounted for the largest percentage of the collective CED.
- Ninety-nine percent of this dose was accrued at Y-12 due to Enriched Uranium Operations.
Collective CED (person-rem)
Radionuclide Site 2024 % U-234 Oak Ridge: Y-12 41.839 98.5% U-234 PGDP 0.119 0.3% Collective CED (person-rem)
Radionuclide Site 2024 % H-3 Oak Ridge: ORNL 0.037 0.1% H-3 LANL 0.035 0.1% H-3 LLNL 0.032 0.1% H-3 SRNL 0.021 0.0% H-3 Oak Ridge: Y-12 0.002 0.0% Collective CED (person-rem)
Radionuclide Site 2024 % U-238 PGDP 0.1 0.2% Collective CED (person-rem)
Radionuclide Site 2024 % Am-241 Idaho 0.051 0.1% C-14 LANL 0.035 0.1% MIX Hanford: Hanford Site 0.003 0.0% Np-237 Oak Ridge: Y-12 0.012 0.0% Pu-238 Idaho 0.007 0.0% Pu-239 SNL 0.034 0.1% Pu-239 INL 0.01 0.0% U TOTAL LANL 0.003 0.0% U-233 Service Center Personnel 0.002 0.0% U-235 PGDP 0.004 0.0% -
Number of Individuals with Measurable CED, Collective CED, and Average Measurable CED
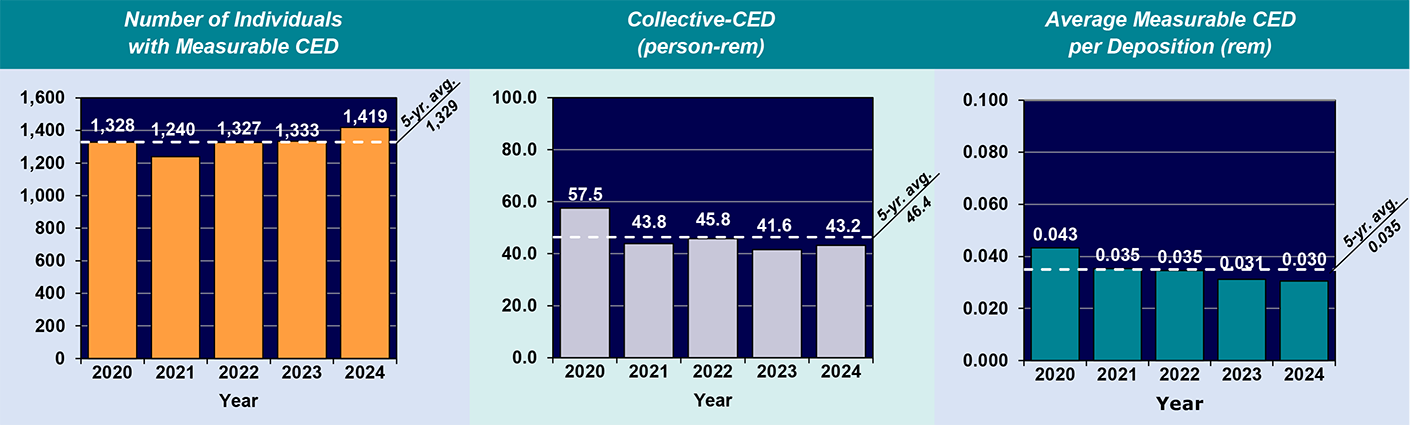
Note: roll over each chart for additional information regarding the sites. - The number of individuals with measurable CED increased 6 percent from 1,333 in CY 2023 to 1,419 in CY 2024, and the collective CED increased by 4 percent.
- The average measurable CED per deposition decreased 3 percent from 0.031 rem (0.310 mSv) in CY 2023 to 0.030 rem (0.300 mSv) in CY 2024. Both the collective CED and the average measurable CED remained below the 5-year averages.
- Ninety-seven percent of the collective CED in CY 2024 was from uranium intakes at Y-12 during the operation and management of Enriched Uranium Operations facilities at the site.
Number of Internal Depositions
Site 2020 2021 2022 2023 2024 Hanford: Hanford Site 0 0 1 5 1 Hanford: PNNL 1 0 0 0 0 Idaho 4 1 1 0 1 LLNL 1 3 2 1 0 LANL 26 27 32 27 39 Oak Ridge: ORNL 0 2 1 2 1 Oak Ridge: Y-12 1,222 1,130 1,201 1,226 1,314 PGDP 5 14 10 10 9 PPPL 0 0 14 0 0 SNL 8 6 9 2 9 SRNL 0 0 3 0 0 SRS 9 3 5 2 6 Service Center Personnel 0 0 1 0 0 UMTRA 52 54 47 58 38 WVDP 0 0 0 0 1 Total 1.328 1,240 1,327 1,333 1,419 Collective CED (person-rem)
Site 2020 2021 2022 2023 2024 Hanford: Hanford Site 0.000 0.000 0.004 0.008 0.003 Hanford: PNNL 0.014 0.000 0.000 0.000 0.000 Idaho 0.059 0.012 0.032 0.000 0.069 LLNL 0.056 0.152 0.062 0.011 0.000 LANL 2.640 0.198 0.103 0.117 0.150 Oak Ridge: ORNL 0.000 0.082 0.019 0.070 0.039 Oak Ridge: Y-12 51.644 41.680 43.806 38.757 41.853 PGDP 0.096 0.257 0.261 0.212 0.224 PPPL 0.000 0.000 0.035 0.000 0.000 SNL 0.051 0.068 0.027 0.024 0.072 SRNL 0.000 0.000 0.191 0.000 0.000 SRS 0.034 0.026 0.044 0.018 0.021 Service Center Personnel 0.000 0.000 0.036 0.000 0.000 UMTRA 2.929 1.314 1.185 2.346 0.660 WVDP 0.000 0.000 0.000 0.000 0.154 Total 57.523 43.789 45.805 41.563 43.245 Average Measurable CED per Deposition (rem)
Site 2020 2021 2022 2023 2024 Hanford: Hanford Site 0.000 0.000 0.004 0.002 0.003 Hanford: PNNL 0.014 0.000 0.000 0.000 0.000 Idaho 0.015 0.012 0.032 0.000 0.069 LLNL 0.056 0.051 0.031 0.011 0.000 LANL 0.102 0.007 0.003 0.004 0.004 Oak Ridge: ORNL 0.000 0.041 0.019 0.035 0.039 Oak Ridge: Y-12 0.042 0.037 0.036 0.032 0.032 PGDP 0.019 0.018 0.026 0.000 0.025 PPPL 0.000 0.000 0.002 0.000 0.000 SNL 0.006 0.011 0.003 0.012 0.008 SRNL 0.000 0.000 0.064 0.000 0.000 SRS 0.004 0.009 0.009 0.009 0.004 Service Center Personnel 0.000 0.000 0.036 0.000 0.000 UMTRA 0.056 0.024 0.025 0.040 0.017 WVDP 0.000 0.000 0.000 0.000 0.154 Cumulative Average 0.043 0.035 0.035 0.031 0.030 -
Average Measurable TED
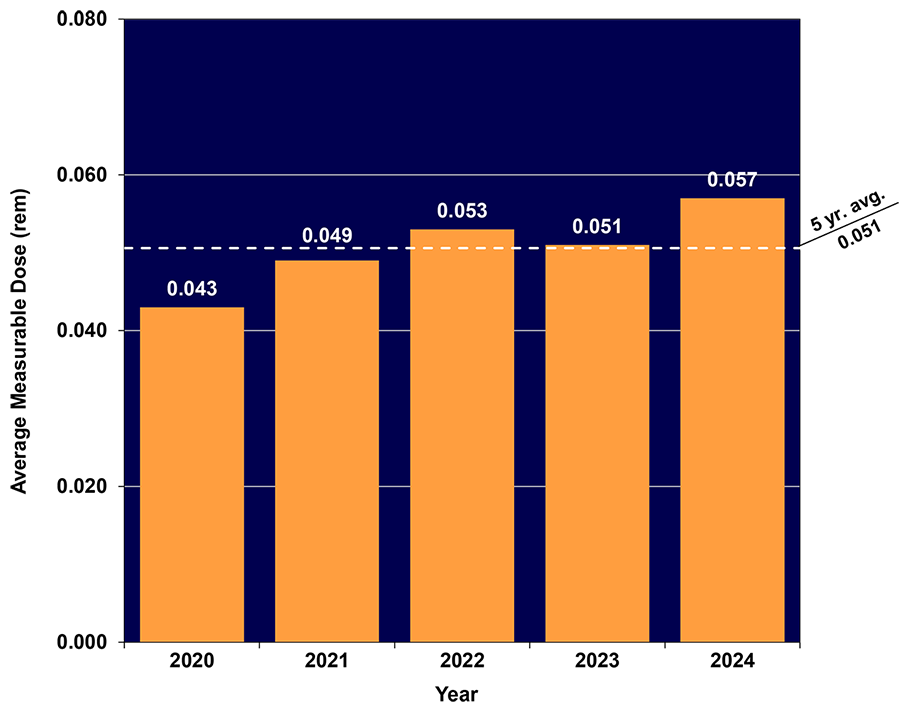
Note: roll over the yearly bar for additional information regarding the sites and their average measurable TED. - The average measurable dose to DOE monitored individuals, a key radiation dose indicator, is calculated by dividing the collective TED by the number of individuals with measurable dose.
- The average measurable TED increased by 12 percent from 0.051 rem (0.510 mSv) in CY 2023 to 0.057 rem (0.570 mSv) in CY 2024.
Average TED by Site for 2020
Site Rem Site Rem UMTRA 0.126 Ames Laboratory 0.026 LANL 0.092 SRNL 0.026 Service Center Personnel 0.092 NNSS 0.025 WVDP 0.079 PGDP 0.023 Oak Ridge: ORNL 0.078 Hanford: PNNL 0.021 SLAC 0.073 Hanford: Hanford Site 0.020 ANL 0.071 WIPP 0.017 LBNL 0.060 OST 0.012 LLNL 0.059 BNL 0.010 Idaho 0.048 NREL 0.008 Fermilab 0.047 Oak Ridge: ETTP 0.007 Oak Ridge: Y-12 0.042 ETEC 0.006 SNL 0.037 KC-NSC 0.005 Pantex Plant 0.032 PPPL 0.004 Hanford: ORP 0.029 Grand Junction Site 0.003 TJNAF 0.028 PGDP 0.027 SRS 0.027 Average TED by Site for 2021
Site Rem Site Rem UMTRA 0.121 SNL 0.029 WVDP 0.112 PORTS 0.029 LLNL 0.101 Hanford: Hanford Site 0.028 Service Center Personnel 0.093 PGDP 0.027 LANL 0.072 Ames 0.024 Idaho 0.069 WIPP 0.016 ANL 0.067 BNL 0.016 Pantex 0.059 OST 0.014 Oak Ridge: ORNL 0.055 KC-NSC 0.014 NNSS 0.048 Oak Ridge: ORISE 0.013 LBNL 0.045 SPRU 0.012 TJNAF 0.041 Oak Ridge: ETTP 0.009 Hanford: ORP 0.039 Grand Junction Site 0.006 Oak Ridge: Y-12 0.038 PPPL 0.005 Hanford: PNNL 0.032 NREL 0.000 Fermi 0.031 SLAC 0.000 SRNL 0.031 SRS 0.030 Average TED by Site for 2022
Site Rem Site Rem WVDP 0.109 PORTS 0.032 LLNL 0.092 Hanford: Hanford Site 0.031 LANL 0.083 SRS 0.031 UMTRA 0.078 Service Center Personnel 0.029 ANL 0.075 BNL 0.023 Hanford: PNNL 0.062 Ames 0.022 Fermi 0.061 SRNL 0.021 Oak Ridge: ORNL 0.060 WIPP 0.018 NNSS 0.054 SPRU 0.016 Pantex 0.054 TJNAF 0.016 Idaho 0.053 Oak Ridge: ETTP 0.011 OST 0.052 Oak Ridge: ORISE 0.010 SNL 0.051 PPPL 0.005 LBNL 0.041 Grand Junction Site 0.003 Hanford: ORP 0.040 KC-NSC 0.003 Oak Ridge: Y-12 0.036 NREL 0.002 PGDP 0.036 Average TED by Site for 2023
Site Rem Site Rem LLNL 0.084 BNL 0.033 LANL 0.083 Oak Ridge: Y-12 0.032 Pantex 0.071 SRNL 0.029 SNL 0.071 Hanford: PNNL 0.028 UMTRA 0.071 Ames 0.023 Idaho 0.059 SLAC 0.018 WVDP 0.059 WIPP 0.018 NNSS 0.055 TJNAF 0.017 Oak Ridge: ORNL 0.055 Oak Ridge: ORISE 0.016 Hanford: Hanford Site 0.047 SPRU 0.013 LBNL 0.043 OST 0.012 PGDP 0.043 Oak Ridge: ETTP 0.010 ANL 0.039 PPPL 0.007 Fermi 0.039 KCNSC 0.005 Hanford: ORP 0.039 NREL 0.003 PORTS 0.039 Grand Junction Site 0.002 Service Center Personnel 0.039 SRS 0.038 Average TED by Site for 2024
Site Rem Site Rem Service Center Personnel 0.128 SRS 0.040 LANL 0.098 PORTS 0.039 OST 0.098 Hanford: ORP 0.033 LBNL 0.073 Oak Ridge: Y-12 0.033 Pantex 0.070 Fermi 0.031 Idaho 0.067 Hanford: Hanford Site 0.029 LLNL 0.067 Ames 0.023 WVDP 0.065 SRNL 0.023 Oak Ridge: ORNL 0.062 WIPP 0.018 PGDP 0.061 TJNAF 0.016 NNSS 0.058 KCNSC 0.015 UMTRA 0.055 Oak Ridge: ETTP 0.012 SNL 0.051 SPRU 0.011 Hanford: PNNL 0.047 Oak Ridge: ORISE 0.008 BNL 0.045 PPPL 0.005 SLAC 0.045 Grand Junction Site 0.001 ANL 0.044 NREL 0.001 -
Air Sampling Measurements
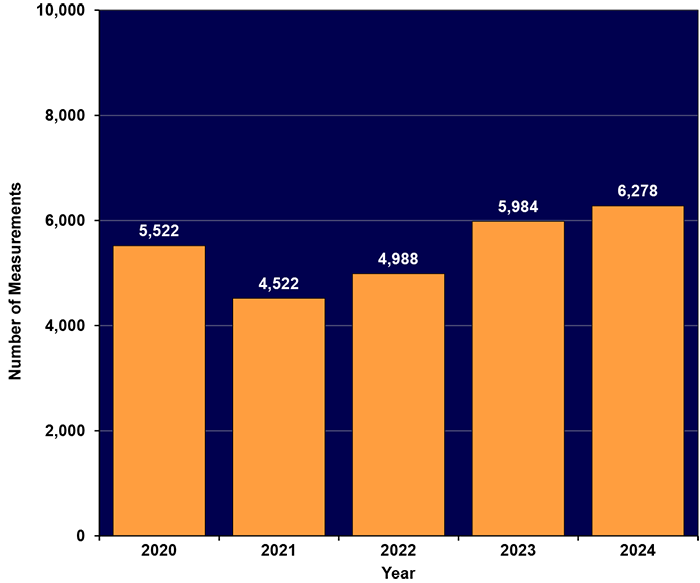
Note: roll over the bars for additional information regarding the sites. - “Air Sampling” accounted for 9 percent of the total measurements.
- Savannah River Site performed the largest number of air sampling measurements, comprising 99 percent of the total air measurements taken in CY 2024.
Note: The numbers shown are based on the number of measurements taken and not the number of individuals monitored. Measurements reported in "Air Sampling" are used to calculate the amount of airborne radioactive material taken into the body and the resultant internal dose.
Air Sampling — Number of Measurements for 2020
Site Number % of Total Hanford: Hanford Site 0 0.00% Idaho 0 0.00% LLNL 0 0.00% NNSS - 0.00% Pantex Plant 505 91.5% SNL 78 1.41% SRS 4,907 88.86% WIPP 32 0.58% Annual Total 5,522 100% Air Sampling — Number of Measurements for 2021
Site Number % of Total Hanford: Hanford Site 0 0.00% Idaho 0 0.00% LLNL 0 0.00% NNSS - 0.00% Pantex Plant - 0.00% SNL 28 0.62% SRS 4,494 99.38% WIPP 0 0.00% Annual Total 4,522 100% Air Sampling — Number of Measurements for 2022
Site Number % of Total Hanford: Hanford Site 0 0.00% Idaho 0 0.00% LLNL 0 0.00% NNSS - 0.00% Pantex Plant - 0.00% SNL 78 1.56% SRS 4,910 98.44% WIPP 0 0.00% Annual Total 4,988 100% Air Sampling — Number of Measurements for 2023
Site Number % of Total Hanford: Hanford Site 0 0.00% Idaho 0 0.00% LLNL 0 0.00% NNSS - 0.00% Pantex Plant - 0.00% SNL 49 0.82% SRS 5,935 99.18% WIPP 0 0.00% Annual Total 5,984 100% Air Sampling — Number of Measurements for 2024
Site Number % of Total Hanford: Hanford Site 0 0.00% Idaho 0 0.00% LLNL 0 0.00% NNSS 0 0.00% Pantex Plant 0 0.00% SNL 60 0.96% SRS 6,218 99.04% WIPP 0 0.00% Annual Total 6,278 100% -
Bioassay Measurements
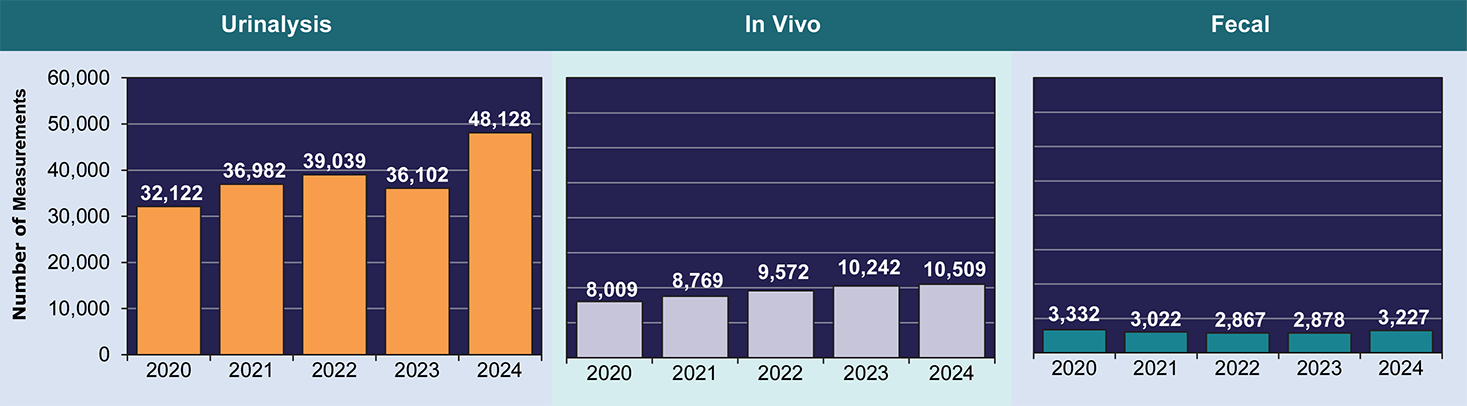
Note: roll over each chart for a breakdown of the sites and their bioassay measurements. - Four sites—Hanford Site, Office of River Protection (ORP), ORNL, and Savannah River Site—accounted for 85 percent of the “In Vivo” measurements.
- Seventy-seven percent of the “Urinalysis” measurements in CY 2024 were performed at four sites: Y-12, LANL, Pantex Plant and Savannah River Site.
- Y-12 and LANL had the largest percentage increases in the number of “Urinalysis” measurements in CY 2024.
- Y-12 performed the largest number of bioassay and air sampling measurements combined, comprising 30 percent of the total measurements taken.
Note: The numbers shown are based on the number of measurements taken and not the number of individuals monitored. The measurements reported as “In Vivo” include direct measurements of the radioactive material in the body of the monitored person. Examples of “In Vivo” measurements include whole body counts and lung or thyroid counts.
Urinalysis — Number of Measurements
Site 2020 2021 2022 2023 2024 Number % of Total Number % of Total Number % of Total Number % of Total Number % of Total ANL 301 1.1% 268 0.8% 283 0.8% 241
0.8% 280 0.8% BNL 10 0.0% 0 0.0% 0 0.0% 0 0.0% 0 0.0% Hanford: Hanford Site 1,717 6.2% 2,309 7.2% 2,681 8.0% 3,122 10.9% 2,140 10.9% Hanford: ORP 1,556 5.6% 1,973 6.2% 1,821 5.4% 2,109 7.4% 1,798 7.4% Hanford: PNNL 935 3.4% 1,001 3.1% 0 0.0% 0 0.0% 1,247 0.0% Idaho 480 1.7% 558 1.7% 358 1.1% 476 1.7% 569 1.7% LBNL - 0.0% - 0.0% - 0.0% 0 0.0% 1 0.0% LLNL 1,109 4.0% 1,109 3.5% 1,278 3.8% 1,404 4.9% 0 4.9% LANL 6,251 22.5% 6,861 21.5% 7,471 22.3% 9,267 32.3% 10,308 32.3% NNSS - 0.0% 437 1.4% 154 0.5% 219 0.8% 56 0.8% Oak Ridge: ETTP 48 0.2% 17 0.1% 51 0.2% 68 0.2% 76 0.2% Oak Ridge: ORISE 34 0.1% 29 0.1% 81 0.2% 27 0.1% 27 0.1% Oak Ridge: ORNL 698 2.5% 754 2.4% 976 2.9% 1,283 4.5% 2,026 4.5% Oak Ridge: Y-12 8,228 29.6% 9,500 29.7% 10,698 32.0% 2,123 7.4% 13,193 7.4% PGDP 1,053 3.8% 1,602 5.0% 1,882 5.6% 2,160 7.5% 2,107 7.5% Pantex Plant 4,309 13.4% 5,021 13.6% 5,779 14.8% 7,514
20.8% 7,592 20.8% PPPL - 0.0% - 0.0% 64 0.2% - 0.0% 0 0.0% PORTS - 0.0% - 0.0% - 0.0% - 0.0% 0 0.0% SNL 370 1.3% 395 1.2% 367 1.1% 366 1.3% 314 1.3% SRS 4,377 15.7% 4,926 15.4% 4,882 14.6% 4,101 14.3% 6,121 14.3% SPRU - 0.0% - 0.0% - 0.0% - 0.0% 0 0.0% Service Center Personnel 538 1.9% 120 0.4% 88 0.3% 1,459 5.1% 109 5.1% WIPP - 0.0% - 0.0% - 0.0% - 0.0% 0 0.0% WVDP 108 0.4% 102 0.3% 125 0.4% 161 0.6% 164 0.6% Annual Total 27,813 100% 31,961 100% 33,428 100% 28,673 100% 47,360 100% In Vivo — Number of Measurements
Site 2020 2021 2022 2023 2024 Number % of Total Number % of Total Number % of Total Number % of Total Number % of Total ANL - 0.0% 3 0.0% 4 0.0% - 0.0% - 0.0% BNL 95 1.2% - 0.0% - 0.0% - 0.0% - 0.0% Hanford: Hanford Site 2,423 30.3% 2,843 32.4% 2,860 29.9% 2,722 26.6% 2,550 24.3% Hanford: ORP 2,033 25.4% 2,164 24.7% 2,166 22.6% 2,182 21.3% 2,183 20.8% Hanford: PNNL - 0.0% 1 0.0% 0.0% - 0.0% - 0.0% Idaho 258 3.2% 342 3.9% 340 3.6% 388 3.8% 311 3.0% LBNL - 0.0% - 0.0% - 0.0% - 0.0% - 0.0% LLNL 214 2.7% 214 2.4% 270 2.8% 274 2.7% 0.0% LANL 293 3.7% 282 3.2% 271 2.8% 267 2.6% 151 1.4% NNSS 0 0.0% 8 0.1% 6 0.1% - 0.0% 5 0.0% Oak Ridge: ETTP 7 0.1% - 0.0% 7 0.1% 3 0.0% 6 0.1% Oak Ridge: ORISE 0 0.0% - 0.0% - 0.0% - 0.0% - 0.0% Oak Ridge: ORNL 519 6.5% 816 9.3% 987 10.3% 1,362 13.3% 2,345 22.3% Oak Ridge: Y-12 110 1.4% 75 0.9% 252 2.6% 560 5.5% 589 5.6% PGDP 0 0.0% - 0.0% Pantex Plant 0 0.0% - 0.0% PPPL 0 0.0% - 0.0% 5 0.1% - 0.0% - 0.0% PORTS 0 0.0% - 0.0% SNL 37 0.5% 19 0.2% 57 0.6% 48 0.5% 51 0.5% SRS 1,727 21.6% 1,801 20.5% 1,909 19.9% 1,946 19.0% 1,839 17.5% SPRU 0 0.0% - 0.0% - 0.0% - 0.0% - 0.0% Service Center Personnel 11 0.1% 8 0.1% - 0.0% 9 0.1% - 0.0% WIPP 0 0.0% - 0.0% - 0.0% - 0.0% - 0.0% WVDP 282 3.5% 193 2.2% 438 0.0% 481 4.7% 479 4.6% Annual Total 8,009 100% 8,.769 100% 9,575 100% 10,242 100% 10,509 100% Fecal — Number of Measurements
Site 2020 2021 2022 2023 2024 Number % of Total Number % of Total Number % of Total Number % of Total Number % of Total ANL 0 0.0% 0 0.0% 0 0.0% 0 0.0% 0 0.0% Hanford: Hanford Site 7 0.2% 12 0.4% 30 1.1% 63 2.2% 21 0.7% Hanford: ORP 0 0.0% 0 0.0% 0 0.0% 0 0.0% 0 0.0% Hanford: PNNL 0 0.0% 0 0.0% 0 0.0% 0 0.0% 3 0.1% Idaho 150 4.5% 111 3.7% 155 5.5% 144 5.1% 114 3.5% LLNL 0 0.0% 0 0.0% 0 0.0% 0 0.0% 0 0.0% LANL 4 0.1% 0 0.0% 0 0.0% 0 0.0% 0 0.0% NNSS 0 0.0% 0 0.0% 0 0.0% 0 0.0% 0 0.0% Oak Ridge: ORNL 0.0% 1 0.0% 0 0.0% 0 0.0% 0 0.0% Oak Ridge: Y-12 2,654 79.9% 2,876 95.9% 2,649 93.2% 2,622 92.7% 3,067 95.1% Pantex Plant 10 0.3% 22 0.7% 24 0.8% 49 1.7% 22 0.7% PPPL - 0.0% - 0.0% 5 0.2% - 0.0% - 0.0% SNL - 0.0% - 0.0% 4 0.1% - 0.0% - 0.0% SRS 0 0.0% 0 0.0% 0 0.0% 0 0.0% 0 0.0% WIPP 507 15.3% 0 0.0% 0 0.0% 0 0.0% 0 0.0% WVDP 0 0.0% 0 0.0% 0 0.0% 0 0.0% 0 0.0% Annual Total 3,332 100% 3,000 100% 2,843 100% 2,829 100% 3,224 100%
Site Data
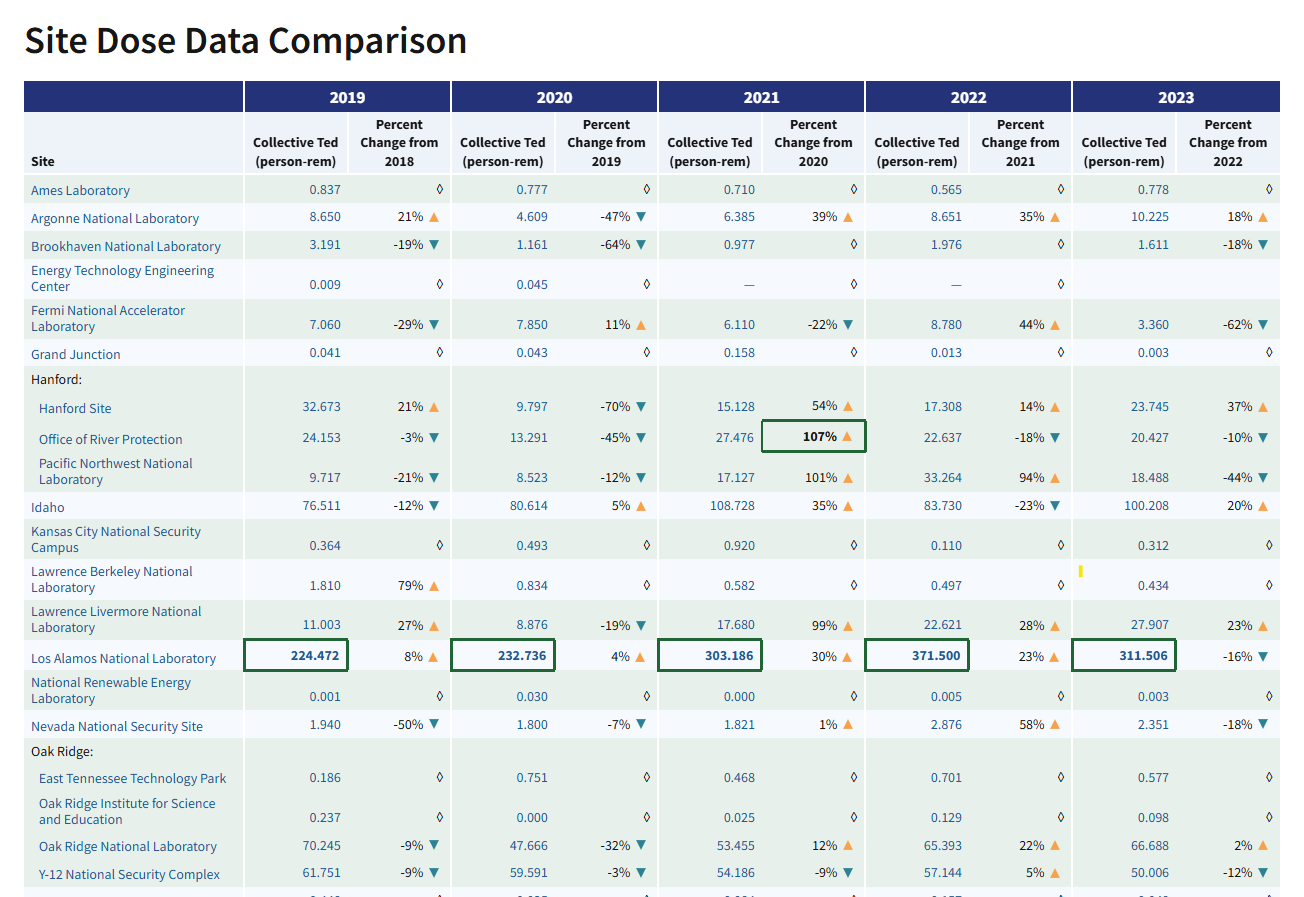
Changes that have the most impact on the overall values at DOE typically occur at sites with large collective TED. For example, the collective TED at LANL increased from 311.506 person-rem (3,115 person-mSv) in CY 2023 to 327.736 person‑rem (3,277 person-mSv) in CY 2024.
Seventeen of the 33 DOE sites reported decreases in the collective TED from the CY 2023 values, and 16 of the 33 DOE sites reported increases in the collective TED from the CY 2023 values.
Seventeen of the 33 reporting sites experienced decreases in the number of workers with a measurable TED from CY 2023 to 2024. The largest decrease in total number of individuals with a measurable TED occurred at Savannah River Site, with a decrease of 1,482 individuals or 26 percent. The second largest decrease in the total number of individuals with a measurable TED occurred at LANL, with a decrease of 404 individuals, or 11 percent.
Sixteen of the 33 reporting sites experienced increases in the number of individuals with a measurable TED from CY 2023 to 2024. The largest increase in the number of individuals receiving a measurable TED occurred at Idaho, with an increase of 138 individuals, or 8 percent.
-
Collective TED by Site
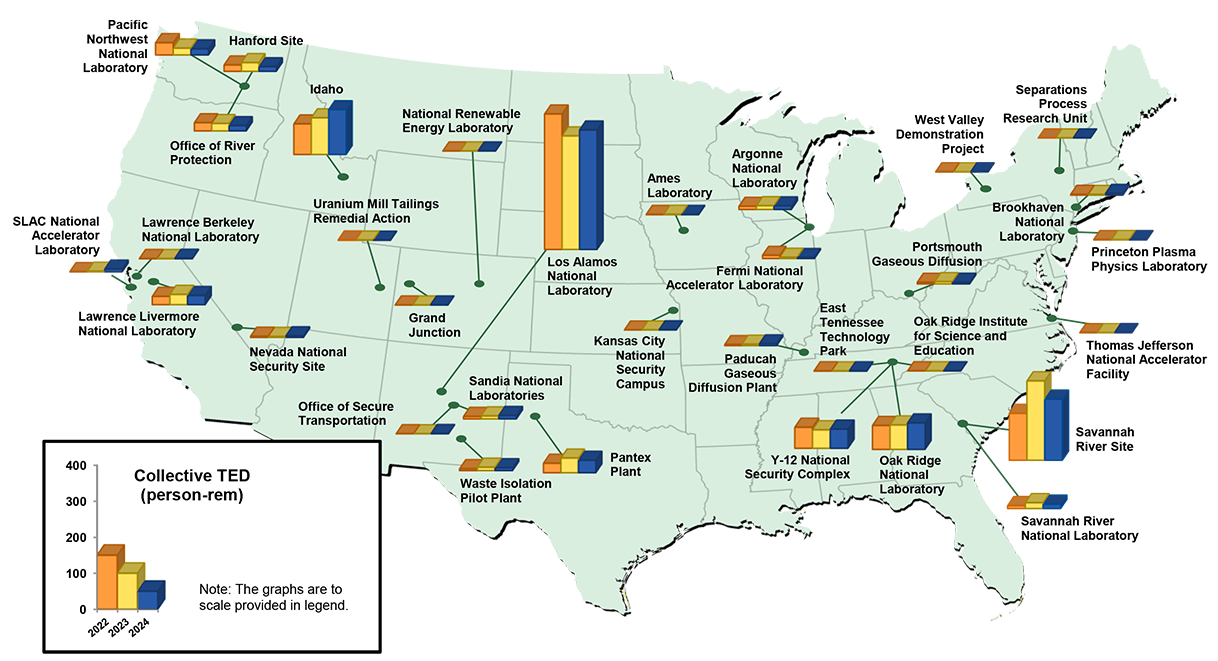
Note: roll over each chart for additional information regarding the site. Site 2022 2023 2024 Ames 0.565 0.778 0.704 Site 2022 2023 2024 ANL 8.651 10.225 9.676 Site 2022 2023 2024 BNL 1.976 1.611 4.531 Site 2022 2023 2024 Fermilab 8.780 3.360 3.040 Site 2022 2023 2024 Grand Junction 0.013 0.003 0.004 Site 2022 2023 2024 Hanford Site 17.308 23.745 12.631 Site 2022 2023 2024 ORP 22.637 20.427 14.672 Site 2022 2023 2024 PNNL 33.264 18.488 16.598 Site 2022 2023 2024 Idaho 83.730 100.316 122.729 Site 2022 2023 2024 KC-NSC 0.110 0.312 0.845 Site 2022 2023 2024 LBNL 0.497 0.434 1.020 Site 2022 2023 2024 LLNL 22.621 27.907 24.999 Site 2022 2023 2024 LANL 371.500 311.506 327.736 Site 2022 2023 2024 NREL 0.005 0.003 0.001 Site 2022 2023 2024 NNSS 2.876 2.351 4.081 Site 2022 2023 2024 ETTP 0.701 0.577 0.829 Site 2022 2023 2024 ORISE 0.129 0.098 0.063 Site 2022 2023 2024 ORNL 65.393 66.688 72.198 Site 2022 2023 2024 Y-12 57.144 50.006 52.164 Site 2022 2023 2024 OST 0.157 0.048 0.786 Site 2022 2023 2024 PGDP 2.983 4.172 5.088 Site 2022 2023 2024 Pantex 25.909 40.176 34.205 Site 2022 2023 2024 PORTS 4.259 5.993 4.436 Site 2022 2023 2024 PPPL 0.255 0.336 0.280 Site 2022 2023 2024 SNL 6.477 7.959 9.181 Site 2022 2023 2024 SRNL 7.665 15.793 11.665 Site 2022 2023 2024 SRS 128.062 216.973 167.097 Site 2022 2023 2024 SPRU 0.016 0.013 0.011 Site 2022 2023 2024 SLAC 0.000 0.036 0.045 Site 2022 2023 2024 TJNAF 0.854 0.612 0.451 Site 2022 2023 2024 UMTRA 4.765 8.905 7.482 Site 2022 2023 2024 WIPP 0.449 0.163 0.268 Site 2021 2022 2023 WVDP 12.145 12.946 7.734 Site 2022 2023 2024 Site Totals 893.125 949.385 926.843 -
Site Dose Data Comparison
2020 2021 2022 2023 2024 Site Collective Ted
(person-rem)Percent Change from 2019 Collective Ted
(person-rem)Percent Change from 2020 Collective Ted
(person-rem)Percent Change from 2021 Collective Ted
(person-rem)Percent Change from 2022 Collective Ted
(person-rem)Percent Change from 2023 Ames Laboratory is a government-owned, contractor-operated research facility of the DOE. For over 65 years, the Ames Laboratory has sought solutions to energy-related problems through the exploration of chemical, engineering, materials, mathematical, and physical sciences.Ames
- The collective TED was 0.777 person-rem (7.770 person-mSv) in CY 2020, which was a slight decrease from CY 2019.
- Activities involving radiation exposure include remediation of radiological legacy contamination; and operation of 23 x-ray systems and 1 Mossbauer spectroscopy system.
- Dose decreased due to less radiation work having been performed onsite due to regional COVID-19 stay at home orders.
◊ Ames
- The collective TED was 0.710 person-rem (7.100 person-mSv) in CY 2021, which was a slight decrease from CY 2020.
- Activities involving radiation exposure include remediation of radiological legacy contamination; and operation of 23 x-ray systems and 1 Mossbauer spectroscopy system.
- Dose decreased due to limited radioactive material work. Radiological activities returned to pre-COVID-19 levels around the middle of the monitoring period. The collective dose reflects normal routine operations and normal variations given the limited number of individuals with measurable dose and the very low doses
◊ Ames
- The collective TED was 0.565 person-rem (5.650 person-mSv) in CY 2022, which was a slight decrease from CY 2021.
- Activities involving radiation exposure included limited radioactive material work, operation of 23 x-ray systems and 1 Mossbauer spectroscopy system, and ongoing remediation of radiological legacy contamination.
- The collective dose reflects normal routine operations and normal variations given the limited number of individuals with measurable dose and the very low doses.
◊ Ames
- The collective TED was 0.778 person-rem (7.780 person-mSv) in CY 2023, which was a slight increase from CY 2022.
- Activities involving radiation exposure included limited radioactive material work, operation of 24 x-ray systems and 1 Mossbauer spectroscopy system, and ongoing remediation of radiological legacy contamination.
- The collective dose reflects normal routine operations and normal variations given the limited number of individuals with measurable dose and the very low doses.
◊ Ames
- The collective TED was 0.704 person-rem (7.040 person-mSv) in CY 2024, which was a slight decrease from CY 2023.
- Activities involving radiation exposure included limited radioactive material work, operation of 24 x-ray systems and 1 Mossbauer spectroscopy system, and ongoing remediation of radiological legacy contamination.
- The collective dose reflects normal routine operations and normal variations given the limited number of individuals with measurable dose and the very low doses.
◊ Argonne National Laboratory (ANL) is one of DOE’s largest national laboratories for scientific and engineering research. ANL’s mission is to apply a unique mix of world-class science, engineering, and user facilities to deliver innovative research and technologies. The principal radiological facilities at the laboratory are the Advanced Photon Source, a superconducting heavy-ion linear accelerator (LINAC), a 22-MeV pulsed electron LINAC, and several other charged-particle accelerators.ANL
- The collective TED was 4.609 person-rem (46.090 person-mSv) in CY 2020, which was a 47 percent decrease from CY 2019.
- Activities involving radiation exposure include work supporting the lab’s radiological facilities; programmatic activities resulting primarily from research activities in the Irradiated Materials Laboratory; and material handling, management, storage, and disposition activities associated with the Alpha Gamma Hot Cell Facility, the Waste Management Operations Facility, and the Radioactive Waste Storage Facility.
- The decreases in collective TED and average measurable TED are attributed to decreased presence of workers on-site and work performed because of COVID-19 restrictions related to Minimum Safe Status and Limited Status Operations.
-47% ANL
- The collective TED was 6.385 person-rem (63.850 person-mSv) in CY 2021, which was a 39 percent increase from CY 2020.
- Activities involving radiation exposure include work supporting the lab’s radiological facilities; programmatic activities resulting primarily from research activities in the Irradiated Materials Laboratory; and material handling, management, storage, and disposition activities associated with the Alpha Gamma Hot Cell Facility, the Waste Management Operations Facility, and the Radioactive Waste Storage Facility.
- The increases in collective TED and average measurable TED are attributed to increased presence of workers on-site and work performed as the laboratory moves out of COVID-19 restrictions related to Minimum Safe Operations.
39% ANL
- The collective TED was 8.651 person-rem (86.510 person-mSv) in CY 2022, which was a 35 percent increase from CY 2021.
- Activities involving radiation exposure include work supporting the lab’s radiological facilities; programmatic activities resulting primarily from research activities in the Irradiated Materials Laboratory; and material handling, management, storage, and disposition activities associated with the Alpha Gamma Hot Cell Facility, the Waste Management Operations Facility, and the Radioactive Waste Storage Facility.
- The increases in collective TED and average measurable TED are attributed to increased presence of workers on-site and work performed as the laboratory moved out of COVID-19 restrictions related to Minimum Safe Operations led to increased dose.
35% ANL
- The collective TED was 10.225 person-rem (102.250 person-mSv) in CY 2023, which was a 18 percent increase from CY 2022.
- Activities involving radiation exposure include work supporting the lab’s radiological facilities; programmatic activities resulting primarily from research activities in the Irradiated Materials Laboratory; and material handling, management, storage, and disposition activities associated with the Alpha Gamma Hot Cell Facility, the Waste Management Operations Facility, and the Radioactive Waste Storage Facility.
- The increase in dose can largely be attributed to the increased volume of workers being monitored.
18% ANL
- The collective TED was 9.676 person-rem (96.760 person-mSv) in CY 2024, which was a 5 percent decrease from CY 2023.
- Activities involving radiation exposure include work supporting the lab’s radiological facilities; programmatic activities resulting primarily from research activities in the Irradiated Materials Laboratory; and material handling, management, storage, and disposition activities associated with the Alpha Gamma Hot Cell Facility, the Waste Management Operations Facility, and the Radioactive Waste Storage Facility.
- In CY 2024, there was a slight decrease in collective TED consistent with year-to-year variation.
-5% Brookhaven National Laboratory (BNL) conducts research in the physical, biomedical, and environmental sciences as well as in energy technologies and national security. BNL also builds and operates major scientific facilities that are available to university, industry, and government researchers.BNL
- The collective TED was 1.161 person-rem (11.610 person-mSv) in CY 2020, which was a 64 percent decrease from CY 2019.
- Activities involving radiation exposure include research involving nuclear and particle physics, accelerator science, and biological systems research; facility maintenance and source replacement; and support for the National Aeronautics and Space Administration Space Radiation Laboratory.
- The decrease in total dose was primarily due to restricted access to the BNL site and most of the personnel teleworking.
-64% BNL
- The collective TED was 0.977 person-rem (9.770 person-mSv) in CY 2021, which was a slight decrease from CY 2020.
- Activities involving radiation exposure include research involving nuclear and particle physics, accelerator science, and biological systems research; facility maintenance and source replacement; and support for the National Aeronautics and Space Administration Space Radiation Laboratory.
- The decrease in total dose was primarily due to restricted access to the BNL site and most of the personnel teleworking in response to the COVID-19 pandemic.
◊ BNL
- The collective TED was 1.976 person-rem (19.760 person-mSv) in CY 2022, which was a slight increase from CY 2021.
- Activities involving radiation exposure include research involving nuclear and particle physics, accelerator science, and biological systems research; facility maintenance and source replacement; and support for the National Aeronautics and Space Administration Space Radiation Laboratory.
- The increase in total dose was primarily due to radiological work performed at the Collider Accelerator and Radiation Control activities.
◊ BNL
- The collective TED was 1.611 person-rem (16.110 person-mSv) in CY 2023, which was a decrease from CY 2023.
- Activities involving radiation exposure include research involving nuclear and particle physics, accelerator science, and biological systems research; facility maintenance and source replacement; and support for the National Aeronautics and Space Administration Space Radiation Laboratory.
- The 18 percent decrease in dose for CY 2023 was primarily due to the implementation of effective radiological control activities.
-18% BNL
- The collective TED was 4.531 person-rem (45.310 person-mSv) in CY 2024, which was an increase from CY 2023.
- Activities involving radiation exposure include accelerator facility maintenance and repair activities; and radioactive waste handling performed at BNL facilities.
- The 64 percent increase in dose for CY 2024 was primarily due to the change-out of the Brookhaven Linac Isotope Producer (BLIP) spur beam window. This requires workers and support staff to be in close proximity to activated material. There was significant job planning, work controls, and use of mock-ups to keep personnel doses ALARA for the evolution.
181% The Energy Technology Engineering Center (ETEC) is located within area IV of the Santa Susana Field Laboratory. The laboratory comprises four discrete operational areas with two adjacent undeveloped properties. In CY 1988, DOE decided to close the remaining ETEC operations. ETEC is currently in a safe shutdown mode, pending the completion of the Environmental Impact Statement.ETEC
- The collective TED was 0.045 person-rem (0.450 person-mSv) in CY 2020. Changes in dose were low and insignificant.
- Activities involving radiation exposure include disposition of government property; cleanup of facilities, demolition of facilities, and site restoration; area IV is undergoing characterization for cleanup of the area; and investigation and remediation of soil and groundwater.
- The CY 2020 increase in dose stems from an increase in the number of individuals monitored, combined with an increase in the number of radiological activities.
◊ ETEC
- ETEC is currently in a safe shutdown mode, pending the completion of the Environmental Impact Statement.
- Activities this year included disposition of government property; cleanup of facilities, demolition of facilities, and site restoration; Area IV is undergoing characterization for cleanup of the area; and investigation and remediation of soil and groundwater.
- In CY 2021, ETEC eliminated personnel dosimeters due to no accessible radiological areas present onsite.
◊ ETEC
- ETEC is currently in a safe shutdown mode, pending the completion of the Environmental Impact Statement.
- Activities this year included disposition of government property; cleanup of facilities, demolition of facilities, and site restoration; Area IV is undergoing characterization for cleanup of the area; and investigation and remediation of soil and groundwater.
- ETEC eliminated personnel dosimeters in CY 2021 due to no accessible radiological areas present onsite.
◊ — ◊ ETEC
- ETEC eliminated personnel dosimeters in CY 2020 due to no accessible radiological areas present onsite.
◊ Fermi National accelerator Laboratory (Fermilab) provides leadership and resources for qualified researchers to conduct basic research at the frontiers of high-energy particle physics and related disciplines. The primary features of the site include the accelerator complex and associated building infrastructure, an interconnected industrial cooling water system, a housing complex for visiting researchers, row crop agriculture, and natural areas in various states of restoration.Fermilab
- During CY 2020, the collective TED was 7.850 person-rem (78.500 person-mSv), which was a 11 percent increase from CY 2019.
- Activities involving radiation exposure include upgrade and repair activities of the Fermilab accelerator complex; installation of new NuMi target, upgrade of water piping, replacement of pre- and HEPA filters, ion pump replacement; and management and disposal of radioactive waste.
- While Fermilab was shut down for four months during the Covid-19 pandemic, upgrades and repairs were completed to prepare the accelerator and associated facilities for new experiments at much higher beam intensities. These activities resulted in an increase in dose from CY2019.
11% Fermilab
- During CY 2021, the collective TED was 6.110 person-rem (61.100 person-mSv), which was a 22 percent decrease from CY 2020.
- Activities involving radiation exposure include upgrade and repair activities of the Fermilab accelerator complex; installation of new NuMi target, upgrade of water piping, replacement of pre- and HEPA filters, ion pump replacement; and management and disposal of radioactive waste.
- Changes in dose occurred due to upgrade and repair activities of the accelerator complex; and the majority of dose to personnel resulted from work performed during the shutdown from June 27 to October 4 of CY 2021. Of the 157 planned jobs, 14 required ALARA plans, and completion of this work contributed significantly to the collective dose during the shutdown.
-22% Fermilab
- During CY 2022, the collective TED was 8.780 person-rem (87.800 person-mSv), which was a 44 percent increase from CY 2021.
- Activities involving radiation exposure include investigation of Muon Campus target rotation problems at AP-0, including removal of the shielding blocks over the target vault; installation of new NuMi condensate pump and target; LCW hose replacement and ion pump cable repair in the MI-300 region of the Main Injector; upgrade and repair activities of the accelerator complex; and upgrade of the beam aperture in the RR-232 region of the Recycler.
- The majority of dose to personnel resulted from work performed during the shutdown from June 11 to November 13 of CY 2022. Of the 763 planned jobs, 84 required Radiological Work Permits (RWPs), and completion of 10 ALARA jobs resulted in activities contributing significantly to the collective dose during the shutdown.
44% Fermilab
- During CY 2023, the collective TED was 3.360 person-rem (33.600 person-mSv), which was a 62 percent decrease from CY 2022.
- Activities involving radiation exposure include Booster MP02 ion pump replacement; NuMi hadron monitor replacement, installation of rope hangers, and air filter changeout in NuMI chase; inspection and replacement of MI-8 ion pump patch cables; upgrade and repair activities of the accelerator complex; and LINAC tank 5 repairs..
- The majority of dose to personnel resulted from work performed during the shutdown from July 17, 2023, through the end of the calendar year. Of the 838 planned jobs, 70 required Radiological Work Permits (RWPs), and completion of 12 ALARA jobs resulted in activities contributing to the collective dose during the shutdown.
-62% Fermilab
- During CY 2024, the collective TED was 3.040 person-rem (30.400 person-mSv), which was a 10 percent decrease from CY 2023.
- Activities involving radiation exposure include recycler alignment work at RR-301 & RR-302, Mu-metal removal from RR-301 & RR-302, Booster RF station ion pump replacement, MI-30 collimator area decontamination, MI-8 collimator area decontamination, and MI-12B RAW system repairs; and MI-30 kicker replacement, Ion pump cable repair in MI-30 region, and Booster RF station 16 repairs were performed outside of the 2024 shutdown period but also contributed to the change in dose.
- Most of the dose resulted from work performed during shutdowns. Fermilab's 2024 shutdown began on 15 July 2024 and ended on 18 November 2024, a duration of 18 weeks. The TED for CY 2024 is within the expected range for a year with a shutdown of this duration; and the completion of 6 ALARA jobs resulted in activities contributing to the collective dose during the shutdown.
-10% The Grand Junction Site was transferred to the Office of Legacy Management (LM) in CY 2003. LM manages the site according to a site-specific Long-Term Surveillance and Maintenance Plan.Grand Junction
- During CY 2020, the collective TED was 0.043 person-rem (0.430 person-mSv).
- Activities involving radiation exposure include conducting annual sampling of groundwater and surface water, validating the analytical data generated from the annual sampling event; conducting an annual site inspection and preparing an inspection report; abandoned mine site inspections; and monitoring well maintenance.
- All doses received were from routine field activities performed by Legacy Management personnel and were very low; and the number of individuals monitored slightly increased from CY 2019 to CY 2020.
◊ Grand Junction
- During CY 2021, the collective TED was 0.158 person-rem (1.580 person-mSv).
- Activities involving radiation exposure include conducting annual sampling of groundwater and surface water, validating the analytical data generated from the annual sampling event; conducting an annual site inspection and preparing an inspection report; abandoned mine site inspections; and monitoring well maintenance.
- All doses received were from routine field activities performed by Legacy Management personnel and were very low.
◊ Grand Junction
- During CY 2022, the collective TED was 0.013 person-rem (0.130 person-mSv). This was a slight decrease from CY 2021.
- Activities involving radiation exposure include walk-over radiological surveys; environmental / geological soil sampling; abandoned mine site inspections; and abandoned mine site reclamation construction activities.
- All doses received were from routine field activities performed by Legacy Management personnel.as they worked to develop a record of all locations and current conditions of legacy uranium mines under the Defense-Related Uranium Mines (DRUM) Program.
◊ Grand Junction
- During CY 2023, the collective TED was 0.003 person-rem (0.030 person-mSv). This was a slight decrease from CY 2022.
- Activities involving radiation exposure include walk-over radiological surveys; environmental/geological soil sampling; abandoned mine site inspections; and abandoned mine site reclamation construction activities.
- All doses received were from routine field activities performed by LM personnel as they worked to develop a record of all locations and current conditions of legacy uranium mines under the Defense-Related Uranium Mines (DRUM) Program.
- There was a decrease in average worker dose combined with an increase in the number of monitored personnel in CY 2023.
◊ Grand Junction
- During CY 2024, the collective TED was 0.004 person-rem (0.040 person-mSv). This was a slight decrease from CY 2023.
- Activities involving radiation exposure include walk-over radiological surveys; environmental/geological soil sampling; and abandoned mine site inspections.
- All doses received were from routine field activities performed by LM personnel as they worked to develop a record of all locations and current conditions of legacy uranium mines under the Defense-Related Uranium Mines (DRUM) The DRUM Program, through its verification and validation work, determined the location, status, and current environmental, human health, and safety conditions of legacy uranium mines throughout the country. Only four individuals received a measurable dose in conjunction with surveillance activities.
◊ Hanford: DOE’s Hanford Site sits on 586 square miles in the desert of southeastern Washington State. The area is home to nine former nuclear reactors and their associated processing facilities that were built beginning in CY 1943. Hanford reactors produced plutonium from CY 1944 until 1987. Today, Hanford workers are involved in an environmental cleanup project and remediation of the site.Hanford Site
- Overall CY 2020 collective TED at Hanford was 9.797 person-rem (97.970 person-mSv), a 70% decrease compared to CY 2019 (32.673 person-rem [326.730 person-mSv]).
- Activites involving radiation exposure include work activities at the plutonium finishing plant facility; material handling and waste transfer; and facility demolition and site remediation.
- Dose decreased in CY 2020 due to COVID-19 partial stop work.
-70% Hanford Site
- Overall CY 2021 collective TED at Hanford was 15.128 person-rem (151.280 person-mSv), a 54% increase compared to CY 2020 (9.797 person-rem [97.970 person-mSv]).
- Activites involving radiation exposure include work activities at the plutonium finishing plant facility; material handling and waste transfer; and facility demolition and site remediation.
- The dose increase in collective TED was attributed to the resumption of operations in CY 2021 as compared with CY 2020 when radiological work was curtailed due to the COVID-19 pandemic.
54% Hanford Site
- Overall CY 2022 collective TED at Hanford was 17.308 person-rem (173.080 person-mSv), a 14% increase compared to CY 2021 (15.128 person-rem [151.280 person-mSv]).
- Activites involving radiation exposure include work activities at the plutonium finishing plant facility; material handling and waste transfer; and facility demolition and site remediation.
- The increase in collective TED was attributed to the resumption of operations in CY 2022 as compared with CY 2020 and CY2021 when radiological work was curtailed due to the COVID-19 pandemic.
14% Hanford Site
- Overall CY 2023 collective TED at Hanford was 23.745 person-rem (237.450 person-mSv), a 37% increase compared to CY 2022 (17.308 person-rem [173.080 person-mSv]).
- Activites involving radiation exposure include work activities at the plutonium finishing plant facility; material handling and waste transfer; and facility demolition and site remediation.
- The small increase in dose during CY 2023 stems mainly from an increase in personnel entries in the cell of building 324 and fire system maintenance at the Solid Waste Operations Complex.
37% Hanford Site
- Overall CY 2024 collective TED at Hanford was 12.631 person-rem (126.310 person-mSv), a 47% decrease compared to CY 2023 (23.745 person-rem [237.450 person-mSv]).
- Activites involving radiation exposure include work activities at the plutonium finishing plant facility; material handling and waste transfer; and facility demolition and site remediation.
- The CY 2024 decrease can be attributed to a decrease in the number of personnel entries into various high dose rate facilities.
-47% The Office of River Protection's (ORP’s) mission is to retrieve and treat Hanford’s waste and close the tank farms to protect the Columbia River. Chemical and radioactive waste, resulting from more than four decades of plutonium production, is currently stored in 177 large underground tanks. ORP is responsible for the retrieval, treatment, and disposal of this waste. The cornerstone of the tank waste cleanup project is the Waste Treatment Plant (WTP). The WTP will use a technology called vitrification to immobilize chemical and radioactive waste in an exceptionally sturdy form of glass to isolate it from the environment.ORP
- The CY 2020 collective TED decreased 45 percent from 24.153 person-rem (241.530 person-mSv) in CY 2019 to 13.291 person-rem (132.910 person-mSv) in CY 2020.
- Activities involving radiation exposure include removal and transfer of waste from older single-shell tanks to newer double-shell tanks; maintenance and support of the evaporator which reduces the volume of stored liquid waste by concentrating radioactive waste solutions; work at the 222-S laboratory; and well logging activities using an AmBe source.
- The decrease in collective TED was attributed to the curtailment of radiological work in 2020 due to the COVID-19 pandemic.
-45% ORP
- The CY 2021 collective TED increased 107 percent from 13.291 person-rem (132.910 person-mSv) in CY 2020 to 27.476 person-rem (274.760 person-mSv) in CY 2021.
- Activities involving radiation exposure include removal and transfer of waste from older single-shell tanks to newer double-shell tanks; maintenance and support of the evaporator which reduces the volume of stored liquid waste by concentrating radioactive waste solutions; work at the 222-S laboratory; and well logging activities using an AmBe source.
- The increase in collective TED was attributed to the resumption of operations in CY 2021 as compared with CY 2020 when radiological work was curtailed due to the COVID-19 pandemic.
107% ORP
- The CY 2022 collective TED decreased 18 percent from 27.476 person-rem (274.760 person-mSv) in CY 2021 to 22.637 person-rem (226.370 person-mSv) in CY 2022.
- Activities involving radiation exposure include removal and transfer of waste from older single-shell tanks to newer double-shell tanks; maintenance and support of the evaporator which reduces the volume of stored liquid waste by concentrating radioactive waste solutions; work at the 222-S laboratory; and well logging activities using an AmBe source.
- The dose reduction is due primarily to a decrease in work activity due to some of the scope run to this year as well the continued efforts from the ALARA program.
-18% ORP
- The CY 2023 collective TED decreased 10 percent from 22.637 person-rem (226.370 person-mSv) in CY 2022 to 20.427 person-rem (204.270 person-mSv) in CY 2023.
- Activities involving radiation exposure include removal and transfer of waste from older single-shell tanks to newer double-shell tanks; maintenance and support of the evaporator which reduces the volume of stored liquid waste by concentrating radioactive waste solutions; work at the 222-S laboratory; and well logging activities using an AmBe source.
- The small dose reduction is due primarily to a technology change introduced in tank farm activities, continued efforts under the ALARA program, and changes in work scope.
-10% ORP
- The CY 2024 collective TED decreased 10 percent from 20.427 person-rem (204.270 person-mSv) in CY 2023 to 14.672 person-rem (146.720 person-mSv) in CY 2024.
- Activities involving radiation exposure include removal and transfer of waste from older single-shell tanks to newer double-shell tanks; maintenance and support of the evaporator which reduces the volume of stored liquid waste by concentrating radioactive waste solutions; work at the 222-S laboratory; and well logging activities using an americium-beryllium source.
- The significant dose reduction is due primarily to a technology change introduced in tank farm activities, continued efforts under the ALARA program, and changes in work scope.
-28% Located in Richland, Washington, Pacific Northwest National Laboratory (PNNL) is 1 of 10 national laboratories managed by DOE’s Office of Science (SC). The laboratory provides the facilities, unique scientific equipment, and world-renowned scientists and engineers to strengthen U.S. scientific foundations through fundamental research and innovation. The lab also supports Hanford site cleanup efforts by performing scientific and technical evaluations and reviews and developing and advancing new technologies to address site cleanup challenges.PNNL
- The collective TED at PNNL in CY 2020 was 8.523 person-rem (85.230 person-mSv), a 12 percent decrease from the previous year (9.717 person-rem [97.170 person-mSv]).
- Activities involving radiation exposure include work at the Radiochemical Processing Laboratory; radiation detection research; and implementation of security measures for radiological materials of concern.
- The decrease in collective dose in CY 2020 reflects an overall lower volume of elevated risk, high dose radiological work.
-12% PNNL
- The collective TED at PNNL in CY 2021 was 17.127 person-rem (171.270 person-mSv), a 101 percent increase from the previous year (8.523 person-rem [85.230 person-mSv]).
- Activities involving radiation exposure include work at the Radiochemical Processing Laboratory; radiation detection research; and implementation of security measures for radiological materials of concern.
- Changes in dose are due to the increased volume of elevated risk high-dose radiological work.
101% PNNL
- The collective TED at PNNL in CY 2022 was 33.264 person-rem (332.640 person-mSv), a 94 percent increase from the previous year (17.127 person-rem [171.270 person-mSv]).
- Activities involving radiation exposure include work at the Radiochemical Processing Laboratory; radiation detection research; and implementation of security measures for radiological materials of concern.
- Changes in dose are due to the increased volume of elevated risk high-dose radiological work.
94% PNNL
- The collective TED at PNNL in CY 2023 was 18.488 person-rem (184.880 person-mSv), a 44 percent decrease from the previous year (33.264 person-rem [332.640 person-mSv]).
- Activities involving radiation exposure include work at the Radiochemical Processing Laboratory; radiation detection research; and implementation of security measures for radiological materials of concern.
- The decrease in dose for CY 2023 is due to the completion of hot cell refurbishment work performed in CY 2022.
-44% PNNL
- The collective TED at PNNL in CY 2024 was 16.598 person-rem (165.980 person-mSv), a 10 percent decrease from the previous year (18.488 person-rem [184.880 person-mSv]).
- Activities involving radiation exposure include work at the Radiochemical Processing Laboratory; radiation detection research; and implementation of security measures for radiological materials of concern.
- The decrease in CY 2024 is primarily driven by a decrease in planned radiological work activities.
-10% The primary focus of activities at the site is nuclear energy research and development at the Idaho National Laboratory. The DOE Idaho Operations Office oversees three major contracts to ensure that operations and research activities are carried out safely and in compliance with laws, regulations, and contract provisions. The Idaho Cleanup Project (ICP) focuses on addressing legacy wastes resulting from decades of widely varied work, including conventional weapons testing, government-owned research and power reactor development and testing, spent nuclear fuel reprocessing, laboratory research, and defense missions.Idaho
- The CY 2020 collective TED at Idaho was 80.614 person-rem (806.140 person-mSv), a 5 percent increase compared with 76.511 person-rem (765.110 person-mSv) in CY 2019.
- Activities involving radiation exposure include work at the Advanced Test Reactor (ATR) Complex, including experiment system operations, plant maintenance and modifications, routine ATR power and outage operations, and Research and Development Operations/Laboratory support; activities at the Materials and Fuel Complex including maintenance and upgrades at the analytical and radiochemistry laboratories, treatment and storage for waste repackaging, benchtop and glovebox operations, decontamination efforts; and waste handling, consolidation and shipment, decontamination work, and radiography operations.
- Dose increased in CY 2020 with increased high-dose work at the ATR. A very small portion of the increase in collective TED was attributed to changing from a quarterly to a semi-annual dosimeter exchange period. The reduction in monitored individuals was attributed to implementation of a dosimeter reduction campaign and site access restrictions due to the COVID-19 pandemic.
5% Idaho
- The CY 2021 collective TED at Idaho was 108.728 person-rem (1,087.280 person-mSv), a 35 percent increase compared with 80.614 person-rem (806.140 person-mSv) in CY 2020.
- Activities involving radiation exposure include work at the Advanced Test Reactor (ATR) Complex, including experiment system operations, plant maintenance and modifications, routine ATR power and outage operations, and Research and Development Operations/Laboratory support; activities at the Materials and Fuel Complex including maintenance and upgrades at the analytical and radiochemistry laboratories, treatment and storage for waste repackaging, benchtop and glovebox operations, decontamination efforts; and waste handling, consolidation and shipment, decontamination work, and radiography operations.
- Dose increased in CY 2021 with increased characterization of waste drums at CPP-659; increased entries in the Integrated Fuel Storage Facility to repair canister lid clamps; and completed several significant tasks in high dose rate areas.
35% Idaho
- The CY 2022 collective TED at Idaho was 83.730 person-rem (837.30 person-mSv), a 23 percent decrease compared with 108.728 person-rem (1,087.280 person-mSv) in CY 2021.
- Activities involving radiation exposure include work at the Advanced Test Reactor (ATR) Complex, including experiment system operations, plant maintenance and modifications, routine ATR power and outage operations, and Research and Development Operations/Laboratory support; activities at the Materials and Fuel Complex including maintenance and upgrades, treatment and storage for waste repackaging, benchtop and glovebox operations, and decontamination efforts; and radiochemistry laboratories, treatment and storage for waste repackaging, benchtop and glovebox operations, decontamination efforts; and waste handling, consolidation and shipment, decontamination work, and radiography operations.
- Dose decreased in CY 2022 with monitored individuals primarily involved with contractor oversight in areas with minimal potential for occupational radiation exposure.
-23% Idaho
- The CY 2023 collective TED at Idaho was 100.208 person-rem (1,002.080 person-mSv), a 20 percent increase compared with 83.730 person-rem (837.300 person-mSv) in CY 2022.
- Activities involving radiation exposure include work at the Advanced Test Reactor (ATR) Complex, including preparations for installation of I-loop components, experiment modifications, maintenance, and operations, and research and development operations/laboratory support; activities at the Materials and Fuel Complex, including maintenance and upgrades, treatment and storage for waste repackaging, benchtop and glovebox operations, and decontamination efforts; and waste handling, consolidation and shipment, decontamination work, and radiography operations.
- The increased dose was a result of completing several significant tasks in high dose rate areas.
20% Idaho
- The CY 2024 collective TED at Idaho was 122.729 person-rem (1,227.290 person-mSv), a 22 percent increase compared with 100.208 person-rem (1,002.080 person-mSv) in CY 2023.
- Activities involving radiation exposure include work at the Advanced Test Reactor (ATR) Complex, including preparations for installation of I-loop components, experiment modifications, maintenance, and operations, and research and development operations/laboratory support; activities at the Materials and Fuel Complex, including maintenance and upgrades, treatment and storage for waste repackaging, benchtop and glovebox operations, and decontamination efforts; and waste handling, consolidation and shipment, decontamination work, and radiography operations.
- The increased dose was a result of completing several significant tasks in high dose rate areas.
22% Kansas City National Security Campus (KC-NSC) is responsible for manufacturing and procuring non-nuclear components for nuclear weapons, including electronic, mechanical, and engineered material components. It supports national laboratories, universities, and U.S. industry and is located in Kansas City, Missouri.KC-NSC
- The collective TED was 0.493 person-rem (4.930 person-mSv) in CY 2020, a decrease from 0.364 person-rem (3.640 person-mSv) in CY 2019.
- Activities involving radiation exposure include non-destructive testing, telemetry (neutron generators); security operations, depleted uranium operations; full production of weapons Life Extension Program; and legacy part refurbishment and waste management.
- The number of radiation workers increased 5% at KC-NSC.
◊ KC-NSC
- The collective TED was 0.920 person-rem (9.200 person-mSv) in CY 2020, a decrease from 0.493 person-rem (4.930 person-mSv) in CY 2020.
- Activities involving radiation exposure include non-destructive testing, telemetry (neutron generators); security operations, depleted uranium operations; full production of weapons Life Extension Program; and legacy part refurbishment and waste management.
- Changes in dose are due to increased production related to the B61-12 Life Extension Program.
◊ KC-NSC
- The collective TED was 0.110 person-rem (1.100 person-mSv) in CY 2022, a decrease from 0.920 person-rem (9.200 person-mSv) in CY 2021.
- Activities involving radiation exposure include non-destructive testing and development projects, telemetry component production and testing with neutron generators; security operations, depleted uranium operations; full production of weapons Life Extension Program; and legacy part refurbishment and waste management.
- This decrease is attributed to a production stabilization following a year of significantly increased production in 2021, likely attributed to production rebound following the pandemic; further improvements are attributed to better dosimetry storage compliance among Emergency Response field workers who travel extensively; and no measured neutron dose was received in 2022 when compared to 120 mrem in 2021.
◊ KC-NSC
- The collective TED was 0.312 person-rem (3.120 person-mSv) in CY 2023, a slight increase from 0.110 person-rem (1.100 person-mSv) in CY 2022.
- Activities involving radiation exposure include non-destructive testing and development projects, telemetry component production and testing with neutron generators; security operations, depleted uranium operations; full production of weapons Life Extension Program; and legacy part refurbishment and waste management.
- This increase is attributed to an expansion of production capacity and the addition of three new permitted radiation processes.
◊ KC-NSC
- The collective TED was 0.845 person-rem (8.450 person-mSv) in CY 2024, a slight increase from 0.312 person-rem (3.120 person-mSv) in CY 2023.
- Activities involving radiation exposure include non-destructive testing and development projects, telemetry component production and testing with neutron generators; security operations; small scale depleted uranium operations; and legacy part refurbishment departments, and waste management.
- The increase in TED is primarily attributed to a single X-ray operator receiving 40 percent of the TED and an increase in the total number of radiation workers; and continued to maintain an ACL of 100 mrem per year, 1/50th of DOE’s 5 rem/year threshold, and an Action Level (AL) of 50 mrem/year. Four radiation workers exceeded the AL and effort to further reduce all exposure going forward continues.
◊ Lawrence Berkeley National Lab (LBNL) is a member of the national laboratory system supported by DOE through its Office of Science (SC) and is charged with conducting unclassified research across a wide range of scientific disciplines. LBNL employs approximately 4,200 scientists, engineers, support staff, and students.LBNL
- The collective TED was 0.834 person-rem (8.340 person-mSv), a slight decrease from CY 2019.
- Activities involving radiation exposure include Fluorine-18 (F-18) research; antineutrino research and experiments; and site inventory of radioactive and nuclear material activities.
- The decrease in the collective TED was due to less radiation work having been performed onsite due to regional COVID-19 stay at home orders and less dose to workers performing maintenance tasks at the 88-inch Cyclotron facility.
◊ LBNL
- The collective TED was 0.582 person-rem (5.820 person-mSv), a slight decrease from CY 2020.
- Activities involving radiation exposure include Fluorine-18 (F-18) research; antineutrino research and experiments; and site inventory of radioactive and nuclear material activities.
- The decrease in the collective TED was due to less dose to workers performing maintenance tasks at the 88-inch Cyclotron facility.
◊ LBNL
- The collective TED was 0.497 person-rem (4.970 person-mSv), a slight decrease from CY 2021.
- Activities involving radiation exposure include Fluorine-18 (F-18) research; antineutrino research and experiments; and site inventory of radioactive and nuclear material activities.
- The decrease in the collective TED is due to facilities personnel receiving slightly less dose while workers performed maintenance tasks at the 88-inch Cyclotron facility, isotope production work at the building 56 medical cyclotron, and radiochemistry work in building 70A.
◊ LBNL
- The collective TED was 0.434 person-rem (4.340 person-mSv), a minimal decrease from CY 2022.
- Activities involving radiation exposure include Fluorine-18 (F-18) research; antineutrino research and experiments; and site inventory of radioactive and nuclear material activities.
- The 13 percent decrease in the collective TED is due to staff at the building 56 medical cyclotron receiving less dose. Workers performing maintenance tasks at the 88-inch Cyclotron facility, isotope production work at the building 56 medical cyclotron, and radiochemistry work in building 70A received doses similar to those received during the previous year.
◊ LBNL
- The collective TED was 1.020 person-rem (10.200 person-mSv), a slight increase from CY 2023.
- Activities involving radiation exposure include Fluorine-18 (F-18) research; antineutrino research and experiments; and site inventory of radioactive and nuclear material activities.
- Two maintenance sessions were performed at the Cyclotron. The maintenance sessions in CY 2024 involved extended work periods to repair a water leak and perform scanning of components; and there was also an increase in personnel dose from radiochemistry work in Building 70A. The Building 70A laboratories reported an increase in the use of Bk-249 and Cf-249 in CY 2024 compared to CY 2023.
◊ Lawrence Livermore National Laboratory (LLNL) is a DOE facility operated by the Lawrence Livermore National Security, LLC management team, which includes Bechtel, the University of California, BWX Technologies, Washington Group, and Battelle. The site serves as a national resource of scientific, technical, and engineering capability with a special focus on national security. LLNL’s mission encompasses such areas as: strategic defense, energy, the environment, biomedicine, technology transfer, education, counterterrorism, and emergency response. The types of radioactive materials range from tritium to TRU; the quantities of each range from nanocuries (i.e., normal environmental background values) to kilocuries.LLNL
- The collective TED for LLNL in CY 2020 was 8.876 person-rem (88.760 person-mSv), a 19 percent decrease from CY 2019.
- Activities involving radiation exposure include radiation producing devices such as x-ray machines, accelerators, and electron-beam welders; and handling a wide range and quantity of radioactive materials.
- The decrease in collective dose was due to a reduction in work posed by COVID conditions.
-11% LLNL
- The collective TED for LLNL in CY 2021 was 17.680 person-rem (176.80 person-mSv), a 99% percent increase from CY 2020.
- Activities involving radiation exposure include radiation producing devices such as x-ray machines, accelerators, and electron-beam welders; and handling a wide range and quantity of radioactive materials.
- Changes in dose were due to increased radiological work relative to that conducted during CY 2020 during the height of the COVID-19 pandemic, the number of individuals monitored increased, and a few individuals received relatively high dose.
99% LLNL
- The collective TED for LLNL in CY 2022 was 22.621 person-rem (226.210 person-mSv), a 28% percent increase from CY 2021.
- Activities involving radiation exposure include radiation producing devices such as x-ray machines, accelerators, and electron-beam welders; and handling a wide range and quantity of radioactive materials.
- Changes in dose were due to 1) the higher amount of radiological work relative to the period of COVID restrictions and 2) a few individuals with relatively high doses. There was a 6.4 percent increase in the monitored population.
28% LLNL
- The collective TED for LLNL in CY 2023 was 27.907 person-rem (279.070 person-mSv), a 23% percent increase from CY 2022.
- Activities involving radiation exposure include radiation-producing devices such as x-ray machines, accelerators, and electron-beam welders; and handling a wide range and quantity of radioactive materials.
- The change in dose was due to 1) an increase in radiological work and/or dose to worker relative to last year and 2) several individuals with relatively high doses, and;
- There was a 9 percent increase in the monitored population from CY 2022 to CY 2023.
23% LLNL
- The collective TED for LLNL in CY 2024 was 27.907 person-rem (279.070 person-mSv), a 10% percent decrease from CY 2023.
- Activities involving radiation exposure include radiation-producing devices, such as X-ray machines, accelerators, and electron-beam welders; and handling a wide range and quantity of radioactive materials.
- The decrease in TED for CY 2024 is primarily due to a work pause impacting individuals expected to receive high doses.
-10% Los Alamos National Laboratory (LANL) conducts radiological operations in active facilities, storage facilities, and facilities with legacy radiological concerns, in addition to operations in inactive facilities and areas destined for decommissioning. Radiological activities include programmatic and production work; facility construction, modification, and maintenance; and research, development, and testing.LANL
- Collective TED at Los Alamos National Laboratory (LANL) was 232.736 person-rem (2,327.360 person-mSv). This was a 4 percent increase from the previous year (224.472 person-rem [2,244.720 person-mSv]).
- Activities involving radiation exposure include weapons manufacturing and related work at the TA-55 plutonium facility; plutonium-238 work; retrieval, repackaging, and shipping of radioactive waste; and infrastructure support for radiological work and facility maintenance.
- A primary contributor to dose in Calendar Year (CY) 2020 was work with Pu-238, producing general purpose heat sources for use individually and in radioisotope thermoelectric generators. A significant portion of LANL dose was accrued by workers commensurate with programmatic and maintenance work at the TA-53 Los Alamos Neutron Science Center.
4% LANL
- Collective TED at Los Alamos National Laboratory (LANL) was 303.186 person-rem (3,031.860 person-mSv). This was a 30 percent increase from the previous year (232.736 person-rem [2,327.360 person-mSv]).
- Activities involving radiation exposure include weapons manufacturing and related work at the TA-55 plutonium facility; plutonium-238 work; retrieval, repackaging, and shipping of radioactive waste; and infrastructure support for radiological work and facility maintenance.
- A primary contributor to dose in CY 2021 was work with Pu-238, producing general purpose heat sources and other infrastructure support for radiological work at the TA-55 plutonium facility; and in CY 2021, there was an increase in work at TA-55, leading, to an increase in the number of personnel, and subsequently, an increase in collective dose.
30% LANL
- Collective TED at Los Alamos National Laboratory (LANL) was 371.500 person-rem (3,715.000 person-mSv). This was a 23 percent increase from the previous year (303.186 person-rem [3,031.860 person-mSv]).
- Activities involving radiation exposure include weapons manufacturing and related work at the TA-55 plutonium facility; plutonium-238 work; retrieval, repackaging, and shipping of radioactive waste; and infrastructure support for radiological work and facility maintenance.
- A primary contributor to dose in CY 2022 was work with Pu-238, producing general purpose heat sources and other infrastructure support for radiological work at the TA-55 plutonium facility; and in CY 2022, there was an increase in work at TA-55, leading, to an increase in the number of personnel, and subsequently, an increase in collective dose.
23% LANL
- Collective TED at Los Alamos National Laboratory (LANL) was 311.506 person-rem (3,115.060 person-mSv). This was a 16 percent decrease from the previous year (371.500 person-rem [3,715.000 person-mSv]).
- Activities involving radiation exposure include weapons manufacturing and related work at the TA-55 plutonium facility; plutonium-238 work; retrieval, repackaging, and shipping of radioactive waste; and infrastructure support for radiological work and facility maintenance.
- In CY 2023, there was an atypical reduction in demand of programmatic heat source work, which contributed greatly to the observed reduction in dose; and
- There was a significant reduction in dose associated with craft labor performing construction activities at the plutonium facility.
-16% LANL
- Collective TED at Los Alamos National Laboratory (LANL) was 327.736 person-rem (3,277,360 person-mSv). This was a 5 percent increase from the previous year (311.506 person-rem [3,115.060 person-mSv]).
- Activities involving radiation exposure include weapons manufacturing and related work at the TA-55 plutonium facility; Plutonium-238 work; retrieval, repackaging, and shipping of radioactive waste; and infrastructure support for radiological work and facility maintenance.
- In CY 2024, TA-55 operations accounted for the majority of occupational dose at LANL. TA-55 began a 24/4 shift schedule largely for construction and maintenance purposes.
- LANL dose was accrued by workers conducting programmatic and maintenance work at the Los Alamos Neutron Science Center accelerator facility, analytical chemistry operations, and waste management activities.
5% The National Renewable Energy Laboratory (NREL) focuses on creative answers to today's energy challenges. From fundamental science and energy analysis to validating new products for the commercial market, NREL researchers are dedicated to transforming the way the world uses energy. With more than 35 years of successful innovation in energy efficiency and renewable energy, NREL discoveries provide sustainable alternatives for powering homes, businesses, and transportation systems.NREL
- The collective TED for CY 2020 measured 0.030 person-rem (0.300 person-mSv), which was a slight increase from 0.001 person-rem (0.010 person-mSv) in CY 2019.
- Activities involving radiation exposure involved electron microscopy staining; and operation of analytical and process equipment containing sealed sources.
- The increase in dose for CY 2020 was not significant, and was due to an increase in work involving radiation exposure and the completion of decontamination activities. Due to the small number of individuals with measurable dose, these small differences are within normal variations.
◊ NREL
- The collective TED for CY 2021 measured 0.000 person-rem (0.000 person-mSv).
- Activities involving radiation exposure involved electron microscopy staining; and operation of analytical and process equipment containing sealed sources.
- Due to the small number of individuals with measurable dose, these small differences are within normal variations; and site activity continued to be reduced due to COVID-19.
◊ NREL
- The collective TED for CY 2022 measured 0.005 person-rem (0.050 person-mSv).
- Activities involving radiation exposure involved electron microscopy staining; and operation of analytical and process equipment containing sealed sources.
- The primary reason for the decrease in dose was a decrease in work time involving radiation exposure surrounding x-ray generating equipment.
◊ NREL
- The collective TED for CY 2023 measured 0.003 person-rem (0.030 person-mSv). This was a minimal decrease from CY 2022.
- Activities involving radiation exposure involved operation of analytical and process equipment containing sealed sources.
- The primary reason for the decrease in dose was a decrease in work time involving radiation exposure surrounding x-ray-generating equipment.
◊ NREL
- The collective TED for CY 2024 measured 0.003 person-rem (0.030 person-mSv). This was a minimal decrease from CY 2023.
- Activities involving radiation exposure were limited to periodic wipe and dose surveys of sealed sources by the Radiological Safety Officer and routine use of commercial “off the shelf” X-ray generating devices.
- The primary reason for the decrease in dose was a decrease in work time involving radiation exposure surrounding x-ray-generating equipment.
◊ The Nevada National Security Site (NNSS) is located approximately 65 miles northwest of Las Vegas. It is a remote facility that covers approximately 1,375 square miles of land. NNSS has been the primary location for testing nuclear experiments in the continental United States since CY 1951.NNSS
- The collective TED for CY 2020 at NNSS was 1.800 person-rem (18.000 person-mSv), which represents a 7 percent decrease in TED from CY 2019.
- Activities involving radiation exosure include operation of low-level radioactive and mixed waste disposal facilities; assembly and execution of subcritical experiments, confined critical experiments; assembly/disassembly of special experiments; operation of pulsed x-ray machines, linear accelerators, and neutron generators; development, testing, and evaluation of radiation detectors; surface cleanup and site characterization of contaminated land areas; and managing environmental activity for the University of Nevada system.
- The decrease in dose was attributed to the decrease in activities associated with critical and special national laboratories experiments because of the change in status from the pandemic.
-7% NNSS
- The collective TED for CY 2021 at NNSS was 1.821 person-rem (18.210 person-mSv), which represents a 1 percent increase in TED from CY 2020.
- Activities involving radiation exosure include operation of low-level radioactive and mixed waste disposal facilities; assembly and execution of subcritical experiments, confined critical experiments; assembly/disassembly of special experiments; operation of pulsed x-ray machines, linear accelerators, and neutron generators; development, testing, and evaluation of radiation detectors; surface cleanup and site characterization of contaminated land areas; and managing environmental activity for the University of Nevada system.
- The increase in dose was attributed to the increase in activities associated with critical and special National Laboratories experiments and the increase in radiological work.
1% NNSS
- The collective TED for CY 2022 at NNSS was 2.876 person-rem (28.760 person-mSv), which represents a 58 percent increase in TED from CY 2021.
- Activities involving radiation exosure include operation of low-level radioactive and mixed waste disposal facilities; assembly and execution of subcritical experiments, confined critical experiments; assembly/disassembly of special experiments; operation of pulsed x-ray machines, linear accelerators, and neutron generators; development, testing, and evaluation of radiation detectors; surface cleanup and site characterization of contaminated land areas; and managing environmental activity for the University of Nevada system.
- The increase in dose was attributed to the increase in activities associated with critical and special National Laboratories experiments, the increase in emergency response training, and the increase in radiological work.
58% NNSS
- The collective TED for CY 2023 at NNSS was 2.351 person-rem (23.510 person-mSv), which represents a 18 percent decrease in TED from CY 2022.
- Activities involving radiation exosure include operation of low-level radioactive and mixed waste disposal facilities; assembly and execution of subcritical experiments, confined critical experiments;
- Assembly/disassembly of special experiments; operation of pulsed x-ray machines, linear accelerators, and neutron generators; development, testing, and evaluation of radiation detectors; surface cleanup and site characterization of contaminated land areas; and Managing environmental activity for the University of Nevada system.
- Information regarding changes in dose was not submitted with annual data.
-18% NNSS
- The collective TED for CY 2024 at NNSS was 4.081 person-rem (40.810 person-mSv), which represents a 74 percent increase in TED from CY 2023.
- Activities involving radiation exosure include operating low-level radioactive and mixed-waste disposal facilities; assembling/executing national-level subcritical experiments, confined critical experiments, and special experiments in support of the national laboratories; operating pulsed X-ray machines, neutron generators, and linear accelerators; developing, testing, and evaluating radiation detectors, equipment, and systems; developing/providing nuclear and radiological emergency response capabilities/training; conducting surface cleanup and site characterization of contaminated land; and managing environmental activity of the University of Nevada system.
- In CY 2024, the increase in dose was attributed to the increase in monitored individuals involved in activities associated with critical and special national laboratories experiments, the increase in emergency response training, and the increase in radiological work at the NNSS.
74% Oak Ridge: The East Tennessee Technology Park (ETTP) was originally named the Oak Ridge Gaseous Diffusion Plant. As part of the Manhattan Project, the plant was designed to produce enriched uranium for use in atomic weapons operations during World War II. After the war, the plant was renamed the Oak Ridge K-25 Site and produced enriched uranium for the commercial nuclear power industry from CY 1945 to 1985. In CY 1987, DOE renamed the site ETTP and began a major environmental cleanup project with the long-term goal of converting ETTP into a private industrial park.ETTP
- The CY 2020 collective TED was 0.751 person-rem (7.510 person-mSv), an increase from CY 2019 (0.186 person-rem [1.860 person-mSv]).
- Activities involving radiation exposure include continuation of ongoing cleanup activities.
- Small increase of dose reported, but due to the small number of individuals with measurable dose and low dose, these changes are not significant.
◊ ETTP
- The CY 2021 collective TED was 0.468 person-rem (4.680 person-mSv), a decrease from CY 2020 (0.751 person-rem [7.510 person-mSv]).
- Activities involving radiation exposure include continuation of ongoing cleanup activities.
- Work focused on shifting to cleanup and demolition at the Oak Ridge National Laboratory.
◊ ETTP
- The CY 2022 collective TED was 0.701 person-rem (7.010 person-mSv), a slight increase from CY 2021 (0.468 person-rem [4.680 person-mSv]).
- Activities involving radiation exposure include continuation of ongoing cleanup activities.
- The change in dose resulted from participation in cleanup and demolition activities.
◊ ETTP
- The CY 2023 collective TED was 0.577 person-rem (5.770 person-mSv), a slight decrease from CY 2022 (0.701 person-rem [7.010 person-mSv]).
- Activities involving radiation exposure include continuation of ongoing cleanup activities.
- The change in dose resulted from participation in routine cleanup and demolition activities.
◊ ETTP
- The CY 2024 collective TED was 0.829 person-rem (8.290 person-mSv), a slight increase from CY 2023 (0.577 person-rem [5.770 person-mSv]).
- Activities involving radiation exposure include continuation of ongoing cleanup activities.
- The change in dose resulted from participation in routine cleanup and demolition activities.
◊ Oak Ridge Institute for Science and Education (ORISE) is a DOE institute focusing on scientific initiatives to research health risks from occupational hazards, assess environmental cleanup, respond to radiation medical emergencies, support national security and emergency preparedness, and educate the next generation of scientists.ORISE
- The collective TED for the CY 2020 monitoring year was 0.000 person-rem (0.000 person-mSv), a decrease from CY 2019 (0.237 person-rem [2.370 person-mSv]).
- Activities involving radiation exposure include independent verification activities involving radiological surveys at sites undergoing decommissioning; and environmental sample processing and radiological protection.
- Due to COVID-19 restrictions, no radiological site work was performed during the period.
◊ ORISE
- The collective TED for the CY 2021 monitoring year was 0.025 person-rem (0.250 person-mSv), an increase from CY 2020 (0.000 person-rem [0.000 person-mSv]).
- Activities involving radiation exposure include independent verification activities involving radiological surveys at sites undergoing decommissioning; and environmental sample processing and radiological protection.
- Due to COVID-19 restrictions, no radiological site work was performed during the period.
◊ ORISE
- The collective TED for the CY 2022 monitoring year was 0.129 person-rem (1.290 person-mSv), a minimal increase from CY 2021 (0.025 person-rem [0.250 person-mSv]).
- Activities involving radiation exposure include independent verification activities involving radiological surveys at sites undergoing decommissioning; and environmental sample processing and radiological protection.
- Dose to radiological workers remained low in CY 2022. Only two individuals received a measurable dose in conjunction with health physics training activities.
◊ ORISE
- The collective TED for the CY 2023 monitoring year was 0.098 person-rem (0.980 person-mSv), a minimal decrease from CY 2022 (0.129 person-rem [1.290 person-mSv]).
- Activities involving radiation exposure include independent verification activities involving radiological surveys at sites undergoing decommissioning; and environmental sample processing and radiological protection.
- Dose to radiological workers remained low in CY 2023. Only six individuals received a measurable dose in conjunction with health physics training activities.
◊ ORISE
- The collective TED for the CY 2024 monitoring year was 0.098 person-rem (0.980 person-mSv), a minimal decrease from CY 2023 (0.098 person-rem [0.980 person-mSv]).
- Activities involving radiation exposure include independent verification activities involving radiological surveys at sites undergoing decommissioning; and environmental sample processing and radiological protection.
- Dose to radiological workers remained low in CY 2024. Only eight individuals received a measurable dose in conjunction with health physics training activities.
◊ Oak Ridge National Laboratory (ORNL) is a multiprogramming science and technology laboratory. ORNL’s mission is to deliver scientific discoveries and technical breakthroughs that will accelerate the development and deployment of solutions in clean energy and global security, and, in doing so, create economic opportunity for the nation. ORNL also performs other work for DOE, including isotope production, information management, and technical program management, and provides research and technical assistance to other organizations.ORNL
- The collective TED for ORNL in CY 2020 was 47.666 person-rem (476.660 person-mSv). This represents a 32 percent decrease from CY 2019 (70.245 person-rem [702.450 person-mSv]).
- Activities involving radiation exposure included work related to the Spallation Neutron Source and the High Flux Isotope Reactor; nuclear reactor research and radioisotope production; and facility maintenance.
- COVID-19 prevention measures interrupted some irradiated materials characterization and radiochemical work that typically comprised a larger fraction of the collective dose.
-32% ORNL
- The collective TED for ORNL in CY 2021 was 53.455 person-rem (534.550 person-mSv). This represents a 12 percent increase from CY 2020 (47.666 person-rem [476.660 person-mSv]).
- Activities involving radiation exposure included work medical radioisotope production; processing low-level and transuranic (TRU) waste at the TRU Waste Processing Center; providing materials for National Aeronautics and Space Administration; and facility maintenance.
- Changes in dose were due to increase in monitored individuals along with increasing work activities after COVID-19 restrictions were relaxed resulted in an increase in the collective TED; and decrease in the production of radioisotopes because of the restructuring of facility and work safety processes and fewer planned hot cell and manipulator maintenance projects resulted in a lower average measurable TED.
12% ORNL
- The collective TED for ORNL in CY 2022 was 65.393 person-rem (653.930 person-mSv). This represents a 22 percent increase from CY 2021 (53.455 person-rem [534.550 person-mSv]).
- Activities involving radiation exposure included medical radioisotope production; processing low-level and transuranic (TRU) waste at the TRU Waste Processing Center; extracting Thorium and down-blending uranium oxide at ISOTEK; providing materials for National Aeronautics and Space Administration (NASA); and facility maintenance.
- Changes in dose were primarily due to increases in operations activities and radioisotope production, particularly radioisotope production for industrial sponsors. Additionally, the number of ORNL monitored individuals increased by 28 percent over CY 2021. Radiation exposure increased when workers moved from processing in shielded gloveboxes to hot cells.
22% ORNL
- The collective TED for ORNL in CY 2023 was 66.688 person-rem (666.880 person-mSv). This represents a 2 percent increase from CY 2022 (65.393 person-rem [653.930 person-mSv]).
- Activities involving radiation exposure included medical radioisotope production; processing low-level and transuranic (TRU) waste at the TRU Waste Processing Center; extracting Thorium and down-blending uranium oxide at ISOTEK; providing materials for National Aeronautics and Space Administration (NASA); and facility maintenance.
- The two percent increase in collective TED is primarily attributed to increases in operations activities and radioisotope production, particularly radioisotope production for industrial sponsors. Additionally, the number of ORNL monitored individuals increased by six percent over CY 2022, and;
- Radiation exposure increased when workers moved from processing in shielded gloveboxes to hot cells.
2% ORNL
- The collective TED for ORNL in CY 2024 was 72.198 person-rem (721.980 person-mSv). This represents an 8 percent increase from CY 2023 (66.688 person-rem [666.880 person-mSv]).
- Activities involving radiation exposure included medical radioisotope production; processing low-level and transuranic (TRU) waste at the TRU Waste Processing Center; extracting thorium and down-blending uranium oxide at ISOTEK; providing materials for National Aeronautics and Space Administration (NASA); and facility maintenance.
- The increase in collective TED is primarily attributed to increases in operations activities and radioisotope production, particularly radioisotope production for industrial sponsors. Additionally, the number of ORNL monitored individuals increased by twelve percent over CY 2023.
8% Y-12 National Security Complex (Y-12) is one of four production facilities in the National Nuclear Security Agency (NNSA) Nuclear Security Enterprise. The facility’s emphasis is the processing and storage of uranium and development of technologies associated with those activities. Y-12 maintains the safety, security, and effectiveness of the U.S. nuclear weapons stockpile and processes highly enriched uranium for the Naval Nuclear Propulsion Program.Y-12
- The collective TED decreased 3 percent from 61.751 person-rem (617.510 person-mSv) in CY 2019 to 59.591 person-rem (595.910 person-mSv) in CY 2020.
- Activities involving radiation exposure include manufacture, processing, and storage of special materials; characterization and hazardous waste removal at Y-12 Biology Complex; and maintenance of equipment and facilities.
- In CY 2020, pauses were enacted across the site due to COVID-19 protocols, resulting in a decrease in overall dose. Sampling protocols were impacted because the length of time between the requested appointment date and the actual sample submission date was increased for some bioassay participants and because of the nature of the chronic exposure scenario resulted in a corresponding increase in internal dose.
-3% Y-12
- The collective TED decreased 9 percent from 59.591 person-rem (595.910 person-mSv) in CY 2020 to 54.186 person-rem (541.860) person-mSv) in CY 2021.
- Activities involving radiation exposure include manufacture, processing, and storage of special materials; characterization and hazardous waste removal at Y-12 Biology Complex; and maintenance of equipment and facilities.
- In CY 2021, work was resumed after COVID-19 paused radiological work activities; and continued cleaning activities.
-9% Y-12
- The collective TED increased 5 percent from 54.186 person-rem (541.860 person-mSv) in CY 2021 to 57.144 person-rem (571.440 person-mSv) in CY 2022.
- Activities involving radiation exposure include manufacture, processing, and storage of special materials; characterization and hazardous waste removal at Y-12 Biology Complex; and maintenance of equipment and facilities.
- The contributing factors that affected the observed increases in the 2022 dose values are a 16 percent increase in the number of individuals monitored coupled with a 3% increase in radiological work as evidenced by the number of entries on Radiological Work Permits (RWPs) in 2022.
5% Y-12
- The collective TED decreased 12 percent from 57.144 person-rem (571.440 person-mSv) in CY 2022 to 50.006 person-rem (500.060 person-mSv) in CY 2023.
- Activities involving radiation exposure include manufacture, processing, and storage of special nuclear materials; characterization and hazardous waste removal at Y-12 Biology Complex; and maintenance of equipment and facilities.
- Activities that affected the observed decrease in CY 2023 dose values include the continued cleaning efforts in radiological areas coupled with downsizing the removable contamination area footprint at the site.
-12% Y-12
- The collective TED increased 4 percent from 50.006 person-rem (500.060 person-mSv) in CY 2023 to 52.164 person-rem (521.640 person-mSv) in CY 2024.
- Activities involving radiation exposure include manufacture, processing, and storage of special nuclear materials; characterization and hazardous waste removal at Y-12 Biology Complex; and maintenance of equipment and facilities.
- In CY 2024, there was an increase in personnel performing work that required internal monitoring as evidenced by the number of entries on bioassay-requiring Radiological Work Permits.
4% The Office of Secure Transportation (OST) is the NNSA organization tasked to provide secure ground transportation of nuclear weapons, special nuclear material (SNM), nuclear weapon components, and nuclear explosive-like assemblies. OST operates both secure ground transporters and Federal aircraft, which make up the Transportation Safeguards System (TSS). The TSS federal agent and vehicle maintenance facilities are located in Oak Ridge, Tennessee; Amarillo, Texas; and Albuquerque, New Mexico. The OST Administrative Headquarters are located at Kirtland Air Force Base in Albuquerque, New Mexico.OST
- The TED to OST workers in CY 2020 was 0.025 person-rem (0.250 person-mSv), which represents a slight decrease from the total person-rem dose in CY 2019.
- Activities involving radiation exposure provided providing secure ground transportation of nuclear weapons, SNM, nuclear weapon components, and nuclear explosive-like assemblies; and tracking and directing cargo loading revisions to minimize radiation exposure.
- Differences were insignificant and variations may be attributed to the small number of individuals (less than 10 for each year). Due to COVID-19 impacts, the overall level of activity decreased.
◊ OST
- The TED to OST workers in CY 2021 was 0.084 person-rem (0.840 person-mSv), which represents a slight increase from the total person-rem dose in CY 2020.
- Activities involving radiation exposure included providing secure ground transportation of nuclear weapons, SNM, nuclear weapon components, and nuclear explosive-like assemblies; and tracking and directing cargo loading revisions to minimize radiation exposure.
- Differences were insignificant and variations may be attributed to the small number of individuals (less than 10 for each year). Due to COVID-19 impacts, the overall level of activity remained low.
◊ OST
- The TED to OST workers in CY 2022 was 0.157 person-rem (1.570 person-mSv), which represents a slight increase from the total person-rem dose in CY 2021.
- Activities involving radiation exposure included providing secure ground transportation of nuclear weapons, SNM, nuclear weapon components, and nuclear explosive-like assemblies; and tracking and directing cargo loading revisions to minimize radiation exposure.
- Differences may be attributed to the small number of individuals (less than 10 for each year); and increases in TED were directly attributable to the return-to-work posture following the COVID-19 pandemic.
◊ OST
- The TED to OST workers in CY 2023 was 0.048 person-rem (0.480 person-mSv), which represents a minimal decrease from the total person-rem dose in CY 2022.
- Activities involving radiation exposure included providing secure ground transportation of nuclear weapons, SNM, nuclear weapon components, and nuclear explosive-like assemblies; and tracking and directing cargo loading revisions to minimize radiation exposure.
- Differences may be attributed to the small number of individuals (less than 10 for each year).
◊ OST
- The TED to OST workers in CY 2024 was 0.786 person-rem (7.860 person-mSv), which represents a slight increase from the total person-rem dose in CY 2023.
- Activities involving radiation exposure included providing secure ground transportation of nuclear weapons, SNM, nuclear weapon components, and nuclear explosive-like assemblies; and tracking and directing cargo loading revisions to minimize radiation exposure.
- Differences may be attributed to the small number of individuals (less than 10 for each year).
◊ The Paducah Gaseous Diffusion Plant (PGDP) is located 3 miles south of the Ohio River and is 12 miles west of Paducah, Kentucky. The plant began enriching uranium in CY 1952, first for the nation's nuclear weapons program and then for nuclear fuel for commercial power plants. In CY 1994, the enrichment facilities were leased to United States Enrichment Corporation (USEC). In August 2013, USEC notified DOE that they were discontinuing enrichment operations and planning to de-lease the enrichment facilities.PGDP
- The overall collective TED for the PGDP was 2.654 person-rem (26.540 person-mSv), an 52 percent decrease from CY 2019.
- Activities involving radiation exposure include continued support of plant operations and maintenance of the Depleted Uranium Hexafluoride project (DUF6) as a nuclear facility; environmental remediation and cleanup activities; waste disposition; and decontamination and decommissioning (D&D) of inactive facilities.
- Plant staffing was reduced to essential personnel March 2020 through September 2020 due to the COVID-19 partial stop work. A large number of staff were able to return to the site after September 2020, but the work scope was refined to a significantly reduced work level.
-52% PGDP
- The overall collective TED for the PGDP was 2.465 person-rem (24.650 person-mSv), a 7 percent decrease from CY 2020.
- Activities involving radiation exposure include continued support of plant operations and maintenance of the Depleted Uranium Hexafluoride project as a nuclear facility; environmental remediation and cleanup activities; waste disposition; and decontamination and decommissioning of inactive facilities.
- Decrease in dose is attributed to primary work scope being performed in non-rad areas and having several employees teleworking due to COVID-19.
-7% PGDP
- The overall collective TED for the PGDP was 2.983 person-rem (29.830 person-mSv), a 21 percent increase from CY 2021.
- Activities involving radiation exposure include continued support of plant operations and maintenance of the Depleted Uranium Hexafluoride project as a nuclear facility; environmental remediation and cleanup activities; surveillance and maintenance activities; waste disposition; and decontamination and decommissioning of inactive facilities.
- The slight increase in CY 2022 was due to more deactivation work with individuals receiving measurable dose at low levels; and plant operations resumed in late 2022 with a graded restart from one operational line up to three during this period. This number is expected to rise slightly in the coming CY 2023 as operations come into full production.
21% PGDP
- The overall collective TED for the PGDP was 4.172 person-rem (41.720 person-mSv), a 40 percent increase from CY 2022.
- Activities involving radiation exposure include continued support of plant operations and maintenance of the Depleted Uranium Hexafluoride project as a nuclear facility; environmental remediation and cleanup activities; surveillance and maintenance activities; waste disposition; and decontamination and decommissioning of inactive facilities.
- Plant operations resumed in late 2022 with a graded restart from one operational line up to three during CY 2023. This number is expected to remain consistent through the coming calendar year (2024).
40% PGDP
- The overall collective TED for the PGDP was 4.172 person-rem (41.720 person-mSv), a 40 percent increase from CY 2023.
- Activities during the reporting period that involved radiation exposure were for continued support of plant operations and maintenance of the Depleted Uranium Hexafluoride project (DUF6) as a nuclear facility. The project's main goal is to convert uranium hexafluoride into a more stable form for the sole purpose of minimizing environmental hazards. Radiation protection efforts involved protection of plant personnel, the public, and the environment; and the Infrastructure Support Services Contractor (ISSC) performs mowing and maintenance activities in radiological areas, such as contamination and high contamination areas, but does not perform work in radiation areas.
- The increase in the collective TED was due to the Paducah facility maintaining four lines of operation for an extended period. With four potential operating lines, personnel exposures increase the more lines that are operating and the length of time they are operating. This number is expected to remain fairly consistent through the coming calendar year 2025. There was a slight increase in dose with no changes in the ISSC work scope from the previous year.
22% The DOE/NNSA Pantex Plant is the nation’s primary facility for the final assembly, disassembly, and maintenance of nuclear weapons. The last new nuclear weapon was completed in CY 1991. Since then, the plant has safely dismantled thousands of weapons retired from the stockpile by the military and placed the resulting plutonium pits in interim storage. Pantex has approximately 650 buildings, including specialized facilities in which maintenance, modification, disassembly, and assembly operations are conducted.Pantex
- The TED to Pantex Plant workers in CY 2020 was 113.909 person-rem (1,139.090 person-mSv), which represents a 370 percent increase from the total person-rem dose in CY 2019.
- Activities involving radiation exposure include operations that expose workers to large numbers of bare weapon pits containing significant quantities of special nuclear material (SNM); and nuclear explosive assembly/disassembly operations, weapon dismantlement programs, life-extension programs, SNM Component Re-qualification, and SNM staging.
- In CY 2020, the Pantex Dosimetry program experienced a failure of the thermoluminescent (e.g., TLD) reading equipment, resulting in the first 3 quarters of dosimeter readings in 2020 being processed at another facility. Due to differences between the thermoluminescent dosimeter readers used, dose calculations were corrected for the reader differences, and a very conservative approach was utilized to ensure all dose was captured. As a result, the dose for Pantex personnel was elevated compared to prior years. Effective Quarter 4 of 2020, Pantex addressed the problems associated with dosimetry equipment by moving to the Y-12 Department of Energy laboratory accreditation program (DOELAP)-accredited dosimetry program.
370% Pantex
- The TED to Pantex Plant workers in CY 2021 was 23.755 person-rem (237.550 person-mSv), which represents a 79 percent decrease from the total person-rem dose in CY 2020.
- Activities involving radiation exposure include operations that expose workers to large numbers of bare weapon pits containing significant quantities of special nuclear material (SNM); and nuclear explosive assembly/disassembly operations, weapon dismantlement programs, life-extension programs, SNM Component Re-qualification, and SNM staging.
- In CY 2020, Pantex suffered a significant breakdown in dosimetry equipment that resulted in dosimeters being processed at an alternate site with additional estimates and calculations performed manually by Pantex personnel. All dose estimates were extremely conservative, elevating the dose results from CY 2020 to abnormally high levels; and the equipment issues have been addressed, and CY 2021 dose levels were similar to CY 2019 levels.
-79% Pantex
- The TED to Pantex Plant workers in CY 2022 was 25.909 person-rem (259.090 person-mSv), which represents a 9 percent increase from the total person-rem dose in CY 2021.
- Activities involving radiation exposure include operations that expose workers to large numbers of bare weapon pits containing significant quantities of special nuclear material (SNM); and nuclear explosive assembly/disassembly operations, weapon dismantlement programs, life-extension programs, SNM Component Re-qualification, and SNM staging.
- The 8 percent dose increase in 2022 is the result of extensive hiring across the plant, double shift work, and other impacts that continue to evolve as goals for Pantex Production expand.
9% Pantex
- The TED to Pantex Plant workers in CY 2023 was 40.176 person-rem (401.760 person-mSv), which represents a 55 percent increase from the total person-rem dose in CY 2022.
- Activities involving radiation exposure include operations that expose workers to large numbers of bare weapon pits containing significant quantities of special nuclear material (SNM); and nuclear explosive assembly/disassembly operations, weapon dismantlement programs, life-extension programs, SNM Component Re-qualification, and SNM staging.
- The 55 percent dose increase in CY 2023 is the result of the continued increase in site personnel, increased production workloads, and other impacts that continue to evolve as goals for Pantex Production expand.
55% Pantex
- The TED to Pantex Plant workers in CY 2024 was 34.205 person-rem (342.050 person-mSv), which represents a 15 percent decrease from the total person-rem dose in CY 2023.
- Activities involving radiation exposure include operations that expose individuals to large numbers of bare weapon pits containing significant quantities of special nuclear material (SNM).
- Nuclear explosive assembly/disassembly operations, weapon dismantlement programs, life-extension programs, SNM Component Re-qualification, and SNM staging.
- The decrease in CY 2024 is the result of the continued awareness of ALARA by employees, workers gaining experience in radiological areas and becoming more efficient, and an increase in protection controls.
-15% The Portsmouth Gaseous Diffusion Plant (PORTS) is located in Pike County, Ohio. PORTS was one of three large gaseous diffusion plants initially constructed to produce enriched uranium to support the nation’s nuclear weapons program and later enrich uranium for commercial nuclear reactors. The plant has been shut down and is currently undergoing decontamination and decommissioning.PORTS
- The collective TED in CY 2020 at PORTS was 1.107 person-rem (11.070 person-mSv), a 74 percent decrease compared with CY 2019.
- Activities involving radiation exposure include site deactivation, decommissioning, and demolition activities; waste handling, processing, and shipment of uranium-bearing materials; processing of uranium (UF6) cylinders; facility decontamination; and uranium barter transfers.
- PORTS began issuing new dosimeters. These new thermoluminescent dosimeters (TLDs) have a greater sensitivity at low levels of radiation resulting in a greater number of positive readings above the minimum reportable dose. Plant staffing was reduced to essential personnel March 2020 through September 2020 due to the COVID-19 partial stop work. Work was subsequently refined to a significantly reduced work level.
-74% PORTS
- The collective TED in CY 2021 at PORTS was 2.029 person-rem (20.290 person-mSv), a 83 percent increase compared with CY 2020.
- Activities involving radiation exposure include site deactivation, decommissioning, and demolition activities; waste handling, processing, and shipment of uranium-bearing materials; processing of uranium cylinders; facility decontamination; and uranium barter transfers.
- The plant began a gradual restart in late CY 2020 and into CY 2021. Work was subsequently returning to pre-COVID work levels.
83% PORTS
- The collective TED in CY 2022 at PORTS was 4.259 person-rem (42.590 person-mSv), a 110 percent increase compared with CY 2021.
- Activities involving radiation exposure include site deactivation, decommissioning, and demolition activities; waste handling, processing, and shipment of uranium-bearing materials; processing of uranium cylinders; facility decontamination; and uranium barter transfers.
- The primary reason for this change was due to a return to full plant operational status in 2022. The Portsmouth facility restarted plant operations in June 2022 with a graded restart from one operational line up to three during this period. This number is expected to rise slightly in the coming calendar year 2023 as operations come into full production.
110% PORTS
- The collective TED in CY 2023 at PORTS was 6.111 person-rem (61.110 person-mSv), a 43 percent increase compared with CY 2022.
- Activities involving radiation exposure include site deactivation, decommissioning, and demolition activities; waste handling, processing, and shipment of uranium-bearing materials; processing of uranium hexafluoride cylinders; facility decontamination; and uranium barter transfers.
- The Portsmouth facility restarted plant operations in June 2022 with a graded restart from one operational line up to three during CY 2023 as operations returned to full production. The dose is as expected and typical for 3 lines operating.
43% PORTS
- The collective TED in CY 2024 at PORTS was 5.667 person-rem (56.670 person-mSv), a 7 percent decrease compared with CY 2023.
- Activities involving radiation exposure include continued support of plant operations and maintenance of the Depleted Uranium Hexafluoride project (DUF6) as a nuclear facility; waste processing, handling and shipment of uranium bearing materials and processing of uranium (UF6) cylinders; and radiation protection efforts involved protection of plant personnel, the public, and the environment.
- The slight decrease in the collective TED was due to the Portsmouth DUF6 facility operational status changes between the two periods. Portsmouth DUF6 facility has three (3) operational lines, and maintenance and planned/unplanned outages can affect the number of lines which are operational at any given time. Although not directly related, the plant’s operational status does play a role in changes (increases and decreases) in personnel exposures over the calendar year. The calendar year dose for CY 2024 is as expected and typical for three lines with varying operability.
-7% The U.S. Department of Energy's Princeton Plasma Physics Laboratory (PPPL) is a collaborative national center for fusion energy research. The laboratory advances the coupled fields of fusion energy and plasma physics research and enhances the scientific understanding and key innovations needed to realize fusion as an energy source for the world. Additional focus is on next-generation computing and microelectronics while partnering with industries shaping these fields to accelerate the development of fusion energy.PPPL
- The collective TED had a slight decrease from CY 2019 (0.391 person-rem [3.910 person-mSv] to CY 2020 (0.234 person-rem [2.340 person-mSv]).
- Activities involving radiation exposure involve experimental and theoretical fusion research; and plasma research and experiments involving radioactive sources and x-ray generating devices.
- The decrease in dose was attributed to COVID-19 decreased work duties.
◊ PPPL
- The collective TED had a slight decrease from CY 2020 (0.234 person-rem [2.340 person-mSv]) to CY 2021 (0.222 person-rem [2.220 person-mSv]).
- Activities involving radiation exposure involve experimental and theoretical fusion research; and plasma research and experiments involving radioactive sources and x-ray generating devices.
- The decrease in dose was attributed to COVID-19 decreased work duties.
◊ PPPL
- The collective TED had a slight decrease from CY 2021 (0.222 person-rem [2.220 person-mSv]) to CY 2022 (0.255 person-rem [2.550 person-mSv]).
- Activities involving radiation exposure involve the remaining tritium systems from the Tokamak Fusion Test Reactor (TFTR) were removed as part of the Tritium System Demolition and Disposal (TSDD) Project. Both internal and external monitoring were utilized for this project, which included removal of the residual tritium inventory within several molecular sieve dryer beds as well as tritium contaminated equipment, components, and piping. Monitoring continued as the project progressed from the Tritium Area within the basement of the research building to the TFTR Test Cell where removal of additional equipment and materials currently continues. Research work involving radioactive sources and x-ray generating devices experienced an increase in activity over the past year compared to the previous 2 years.
- The increase in dose represents a 15 percent increase from the previous monitoring year, which is attributable to the TSDD Project activities.
◊ PPPL
- The collective TED had a minimal increase from CY 2022 (0.255 person-rem [2.550 person-mSv]) to CY 2023 (0.336 person-rem [3.336 person-mSv]).
- Activities involving radiation exposure involve the research work involving radioactive sources and x-ray generating devices; and continued gradual increase in specific work focused on experimental machine upgrades while tritium system demolition and disposal activities are wrapping up.
- Research work involving radioactive sources and x-ray generating devices experienced an increase in activity over the past year compared to the previous 2 years.
◊ PPPL
- The collective TED had a minimal increase from CY 2023 (0.336 person-rem [3.336 person-mSv]) to CY 2024 (0.280 person-rem [2.800 person-mSv]).
- Activities involving radiation exposure involve the research work involving radioactive sources and x-ray generating devices; and continued gradual increase in specific work focused on experimental machine upgrades while tritium system demolition and disposal activities are wrapping up.
- For CY 2024, the collective total effective dose (TED) to PPPL employees decreased from the previous year due to an overall reduction in areas requiring dosimetry and consequently a reduced number of dosimeter wear.
◊ Sandia National Laboratory's (SNL) primary mission is ensuring the U.S. nuclear arsenal is safe, secure, and reliable and can fully support our nation's deterrence policy. SNL is the engineering arm of the U.S. nuclear weapons enterprise. SNL’s foundation is science-based engineering in which fundamental science, computer models, and unique experimental facilities come together so that researchers can understand, predict, and verify weapon systems performance.SNL
- The total collective TED reported was 3.287 person-rem (32.870 person-mSv), a 38 percent decrease from CY 2019.
- Activities involving radiation exposure include operation of a research reactor, gamma irradiation facility, hot cell facility, and several pulsed-power accelerators; conducting light laboratory work involving x-ray machines, tracer radionuclides; and waste operations.
- Decreases are attributed to the COVID-19 pandemic and associated work-from-home order, with no radiological work significantly changing between CY 2019 and CY 2020, only the volume of work being performed onsite decreasing overall.
-38% SNL
- The total collective TED reported was 3.092 person-rem (30.920 person-mSv), a 6 percent decrease from CY 2020.
- Activities involving radiation exposure include operation of a research reactor, gamma irradiation facility, hot cell facility, and several pulsed-power accelerators; conducting light laboratory work involving x-ray machines, tracer radionuclides; and waste operations.
- The CED increase is attributed to increased neutron generator production work performed by fewer individuals onsite due to the COVID-19 pandemic.
-6% SNL
- The total collective TED reported was 6.477 person-rem (64.770 person-mSv), a 109 percent increase from CY 2021.
- Activities involving radiation exposure include operation of a research reactor, gamma irradiation facility, hot cell facility, and several pulsed-power accelerators; conducting light laboratory work involving x-ray machines, tracer radionuclides; and waste operations.
- The 2022 TED and ED increases are directly attributable to the return to work posture following the COVID-19 pandemic as well as the expected 30 percent increase in nuclear weapons development work at Sandia.
109% SNL
- The total collective TED reported was 7.959 person-rem (795.90 person-mSv), a 23 percent increase from CY 2022.
- Activities involving radiation exposure include operation of a research reactor, gamma irradiation facilities, hot cell facilities, and several pulsed power accelerators; conducting light laboratory work involving x-ray machines and tracer radionuclides; and waste operations.
- The increase in dose in 2023 is attributable to the 30 percent increase in nuclear weapons development work at Sandia.
23% SNL
- The total collective TED reported was 9.181 person-rem (91.810 person-mSv), a 15 percent increase from CY 2023.
- Activities involving radiation exposure include operation of a research reactor, gamma irradiation facilities, hot cell facilities, and several pulsed power accelerators; performance of light laboratory work involving X-ray machines and tracer radionuclides; and waste operations.
- The increase in dose in CY 2024 is attributable to measurable dose output from experimentation at the Z machine pulsed-power facility.
15% Savannah River: Savannah River National Laboratory (SRNL) began reporting separately from the Savannah River Site (SRS) effective CY 2016. The laboratory supports DOE in its environmental management and nuclear security missions and applies its expertise in nuclear chemical manufacturing to assist DOE in meeting its objectives in areas, such as nuclear waste cleanup and defense nonproliferation.SRNL
- The CY 2020 collective TED at Savannah River National Laboratory (SRNL) was 11.717 person-rem (117.170 person-mSv). This was a 30 percent decrease from CY 2019 of 16.631 person-rem (166.310 person-mSv).
- Activities involving radiation exposure involved currently, most SRNL programs support the SRS tritium mission. This includes applying hydrogen technologies used in processing tritium; extraction, purification, and storage of tritium; and execution of the Mark-1A Pu-244 recovery program.
- Renovations were completed with the clean out of 20 gloveboxes and radiohoods as part of the SRS’s laboratory consolidation efforts.
-30% SRNL
- The CY 2021 collective TED at Savannah River National Laboratory (SRNL) was 14.896 person-rem (148.960 person-mSv). This was a 27 percent increase from CY 2020 of 11.717 person-rem (117.170 person-mSv).
- Activities involving radiation exposure involved currently, most SRNL programs support the SRS tritium mission. This includes applying hydrogen technologies used in processing tritium; extraction, purification, and storage of tritium; and execution of the Mark-1A Pu-244 recovery program.
- Relocation of the laboratory’s analytical laboratory facilities.
27% SRNL
<ul> <li>The CY 2022 collective TED at Savannah River National Laboratory (SRNL) was 7.665 person-rem (76.650 person-mSv). This was a 49 percent decrease from CY 2021 of 4.073 person-rem (40.730 person-mSv).</li> <li>Activities involving radiation exposure involved currently, most SRNL programs support the SRS tritium mission. This includes applying hydrogen technologies used in processing tritium; extraction, purification, and storage of tritium; and execution of the Mark-1A Pu-244 recovery program.</li> <li>Changes in dose were affected when the Salt Waste Processing Facility (SWPF) joined Savannah River Mission Completion (SRMC) in CY 2022. </li> </ul>-49% SRNL
- The CY 2023 collective TED at Savannah River National Laboratory (SRNL) was 15.793 person-rem (157.930 person-mSv). This was a 106 percent increase from CY 2022 of 7.665 person-rem (76.650 person-mSv).
- Most Savannah River National Laboratory programs support the Savannah River Site tritium mission. Activities involving radiation include applying hydrogen technologies used in processing tritium; the extraction, purification, and storage of tritium; and execution of the Mark-1A plutonium-244 recovery program.
- The Salt Waste Processing Facility (SWPF) set a single-year record by processing nearly 3.2 million gallons of radioactive salt waste.
106% SRNL
- The CY 2024 collective TED at Savannah River National Laboratory (SRNL) was 11.665 person-rem (116.650 person-mSv). This was a 26 percent decrease from CY 2023 of 15.793 person-rem (157.930 person-mSv).
- Currently, most SRNL programs support the SRS tritium mission. This includes applying hydrogen technologies used in processing tritium; extraction, purification, and storage of tritium; and SRNL has begun facility preparations for the Mark 18 Processing Project.
- The dose decreased during CY 2024 as SRNL continued to support SRS by processing samples from all facilities on site.
-26% The Savannah River Site (SRS) was constructed during the early 1950s to produce the basic materials used in the fabrication of nuclear weapons, primarily tritium and plutonium-239, in support of our nation’s defense programs. Five reactors were built to produce these materials. Also built were several support facilities, including two chemical separations plants, a heavy water extraction plant, a nuclear fuel and target fabrication facility, a tritium extraction facility, and waste management facilities.SRS
- The CY 2020 collective TED at Savannah River Site (SRS) was 112.247 person-rem (1,122.470 person-mSv). There was an 11% decrease from CY 2019 of 126.763 person-rem (1,267.630 person-mSv).
- Activities involving radiation exposure involved continued processing Canadian Target Residue Material; finished decommissioning a former nuclear radiological facility; post-closure care at closed reactor facilities; and plutonium down blending.
- CY 2020 dose decreased in comparison with 2019. Innovations such as using drones in post closure areas and optimization process projects in support of K area plutonium down blend helped to reduce radiological exposure.
-11% SRS
- The CY 2021 collective TED at Savannah River Site (SRS) was 137.840 person-rem (1,378.400 person-mSv). There was an 23% increase from CY 2020 of 112.247 person-rem (1,122.470 person-mSv).
- Activities involving radiation exposure involved continued processing Canadian Target Residue Material; finished decommissioning a former nuclear radiological facility; post-closure care at closed reactor facilities; and plutonium down blending.
- CY 2021 dose increased in comparison with CY 2020 as workers safely removed failed vessels from the Hot Canyon; and began process of deactivating 235-F.
23% SRS
<ul> <li>The CY 2022 collective TED at Savannah River Site (SRS) was 128.062 person-rem (1,280.620 person-mSv). There was an 7% decrease from CY 2021 of 137.840 person-rem (1,378.400 person-mSv).</li> <li>Activities involving radiation exposure involved continued processing Canadian Target Residue Material; finished decommissioning a former nuclear radiological facility; post-closure care at closed reactor facilities; and plutonium down blending.</li> <li>CY 2022 dose decreased in comparison with CY 2021 as deactivation work was completed and the Solid Waste Management Facility (SWMF) completed the 10-year campaign to store and ship down blended transuranic (TRU) waste to the Waste Isolation Pilot Plant (WIPP).</li> </ul>-7% SRS
- The CY 2023 collective TED at Savannah River Site (SRS) was 216.973 person-rem (2,169.730 person-mSv). This was a 69% increase from CY 2022 of 128.062 person-rem (1,280.620 person-mSv).
- Activities involving radiation exposure involved the first shipment of down blended plutonium was sent from the site to the Waste Isolation Pilot Plant; and employees reconfigured H Canyon dissolvers to maximize planned operations.
- The dose increased in CY 2023 as the site set a single-year record by processing nearly 3.2 million gallons of radioactive salt waste; and two radioactive structures in the F Tank Farm were successfully closed and grouted.
69% SRS
- The CY 2024 collective TED at Savannah River Site (SRS) was 167.097 person-rem (1,670,970 person-mSv). This was a 23% decrease from CY 2023 of 216.973 person-rem (2,169.730 person-mSv).
- Activities involving radiation exposure involved shipping down blended plutonium from the site to the Waste Isolation Pilot Plant; and the Surplus Plutonium Disposition Team received approval from the Department of Energy to expand down blending capabilities in the K Area Complex.
- The SRS Solid Waste Management Facility saw a large reduction of transuranic (TRU) waste in 2024, achieving the highest volume of TRU waste shipped out of state by the facility in the past 10 year; and workers at the Salt Waste Processing Facility processed an additional 2.8 million gallons of salt waste, bringing the total processed to 9.9 million gallons.
-23% The Separations Process Research Unit (SPRU) is located at Knolls Atomic Power Laboratory based in upstate New York. Built in the 1940s, the buildings supported the SPRU mission to research the chemical process to extract plutonium from irradiated materials. Although the equipment was flushed and drained and bulk waste was removed following the shutdown of the facilities in CY 1953, residual materials are present in the tanks, buildings H2 and G2, and interconnecting pipe tunnels. The site is currently undergoing a variety of cleanup activities, including demolition, decontamination, and remediation.SPRU
- The collective TED for CY 2020 was 0.000 person-rem (0.000 person-mSv), a decrease from CY 2019.
- Activities involving radiation exposure include repackaging transuranic waste; processing and shipping low activity water and waste; and surveillance and maintenance of site condition activities.
- Collective dose decreased due to maintaining proper as low as reasonably achievable controls during quarterly inspections of the TRU waste storage area.
◊ SPRU
- The collective TED for CY 2021 was 0.012 person-rem (0.120 person-mSv), a slight increase from CY 2020.
- Activities involving radiation exposure include repackaging transuranic waste; processing and shipping low activity water and waste; and surveillance and maintenance of site condition activities.
- Collective dose remained low due to maintaining proper as low as reasonably achievable controls during quarterly inspections of the TRU waste storage area.
◊ SPRU
- The collective TED for CY 2022 was 0.016 person-rem (0.160 person-mSv), a slight increase from CY 2021.
- Activities involving radiation exposure include repackaging transuranic waste; processing and shipping low activity water and waste; and surveillance and maintenance of site condition activities.
- Collective dose remained low due to maintaining proper as low as reasonably achievable controls during quarterly inspections of the TRU waste storage area.
◊ SPRU
- The collective TED for CY 2023 was 0.013 person-rem (0.130 person-mSv), a minimal decrease from CY 2022.
- Activities involving radiation exposure include repackaging TRU waste; processing and shipping low activity water and waste; and surveillance and maintenance of site condition activities.
- Collective dose remained low due to maintaining proper ALARA controls during quarterly inspections of the TRU waste storage area.
◊ SPRU
- The collective TED for CY 2024 was 0.011 person-rem (0.110 person-mSv), a minimal decrease from CY 2023.
- Activities involving radiation exposure include repackaging TRU waste; processing and shipping low activity water and waste; and surveillance and maintenance of site condition activities.
- Collective dose remained low due to maintaining proper ALARA controls during quarterly inspections of the TRU waste storage area.
◊ Includes personnel at National Energy Technology Laboratory (NETL), NNSA Albuquerque complex, Oak Ridge, and Waste Isolation Pilot Plant (WIPP) in addition to several smaller facilities not associated with a DOE site.3.116 ◊ 3.719 19% 0.428 ◊ 1.637 ◊ 7.432 354% SLAC National Accelerator Laboratory (SLAC) which opened in CY 1962, is one of 10 DOE SC laboratories and is operated by Stanford University on behalf of DOE. Originally a premier, high-energy particle accelerator laboratory, SLAC has grown into a state-of-the-art photon science laboratory. SLAC's scientific mission has diversified from an original focus on particle physics and accelerator science to include cosmology, materials and environmental sciences, biology, chemistry, and alternative energy research.SLAC
- Collective TED in CY 2020 was 0.146 person-rem (1.460 person-mSv), a slight decrease compared with CY 2019.
- Activities involving radiation exposure include operation of the LINAC Coherent Light Source (LCLS) – the world's first hard x-ray free electron laser; operation of the Stanford Synchrotron Radiation Lightsource – a pioneering synchrotron radiation facility; and operation of the Stanford Positron-Electron Asymmetric Ring (SPEAR3), and a separate, shorter linear accelerator (LINAC), and a booster ring for injecting accelerated beams of electrons into SPEAR3.
- The collective dose reflects normal routine operations and normal variations given the limited number of individuals with measurable dose and the very low doses.
◊ SLAC
- Collective TED in CY 2021 was 0.000 person-rem (0.000 person-mSv), a slight decrease compared with CY 2020.
- Activities involving radiation exposure include operation of the LINAC Coherent Light Source (LCLS) – the world's first hard x-ray free electron laser; operation of the Stanford Synchrotron Radiation Lightsource – a pioneering synchrotron radiation facility; and operation of the Stanford Positron-Electron Asymmetric Ring (SPEAR3), and a separate, shorter linear accelerator (LINAC), and a booster ring for injecting accelerated beams of electrons into SPEAR3.
- The CY 2021 collective TED of 0.0 is a reflection of the fact that no major radiological projects were conducted during CY 2021.
◊ SLAC
- Collective TED in CY 2022 was 0.000 person-rem (0.000 person-mSv).
- Activities involving radiation exposure include operation of the LINAC Coherent Light Source (LCLS) – the world's first hard x-ray free electron laser; operation of the Stanford Synchrotron Radiation Lightsource – a pioneering synchrotron radiation facility; and operation of the Stanford Positron-Electron Asymmetric Ring (SPEAR3), and a separate, shorter linear accelerator (LINAC), and a booster ring for injecting accelerated beams of electrons into SPEAR3; Photon Science: Photon Ultrafast Laser Science and Engineering (PULSE), and Stanford Institute for Material and Energy Sciences (SIMES); Particle Physics and Astrophysics: Experimental Particle Physics, Kavli Institute for Particle Astrophysics and Cosmology (KIPAC), and Accelerator Research and Development; Facilities for Accelerator Science and Experimental Test Beams (FACET-II); and Test Facilities: Next Linear Collider Test Accelerator (NLCTA) and Accelerator Structure Test Area (ASTA).
- The CY 2022 collective TED of 0.0 is a reflection of the fact that no major radiological projects were conducted during CY 2022.
◊ SLAC
- Collective TED in CY 2023 was 0.036 person-rem (0.360 person-mSv). This is a minimal increase from CY 2022.
- Activities involving radiation exposure include:
- Operation of the LINAC Coherent Light Source (LCLS) – the world's first hard x-ray free electron laser; operation of the Stanford Synchrotron Radiation Lightsource – a pioneering synchrotron radiation facility;
- Operation of the Stanford Positron-Electron Asymmetric Ring (SPEAR3), and a separate, shorter linear accelerator (LINAC), and a booster ring for injecting accelerated beams of electrons into SPEAR3;
- Photon Science: Photon Ultrafast Laser Science and Engineering (PULSE), and Stanford Institute for Material and Energy Sciences (SIMES);
- Particle Physics and Astrophysics: Experimental Particle Physics, Kavli Institute for Particle Astrophysics and Cosmology (KIPAC), and Accelerator Research and Development;
- Facilities for Accelerator Science and Experimental Test Beams (FACET-II); and
- Test Facilities: Next Linear Collider Test Accelerator (NLCTA) and Accelerator Structure Test Area (ASTA).
- The CY 2023 collective TED of 0.036 reflects the fact that no major radiological projects were conducted during CY 2023.
◊ SLAC
- Collective TED in CY 2024 was 0.036 person-rem (0.360 person-mSv). This is a minimal increase from CY 2023.
- Activities involving radiation exposure include:
- Linac Coherent Light Source (LCLS and LCLS-II);
- Stanford Synchrotron Radiation Lightsource (SSRL);
- Photon Science: Photon Ultrafast Laser Science and Engineering (PULSE), and Stanford Institute for Material and Energy Sciences (SIMES);
- Particle Physics and Astrophysics: Experimental Particle Physics, Kavli Institute for Particle Astrophysics and Cosmology (KIPAC), and Accelerator Research and Development;
- Facilities for Accelerator Science and Experimental Test Beams (FACET-II); and
- Test Facilities: Next Linear Collider Test Accelerator (NLCTA) and Accelerator Structure Test Area – Ultrafast Electron Diffraction (ASTA-UED).
- The CY 2024 collective TED of 0.045 person-rem primarily reflects doses received by workers supporting the LCLS-II activities during routine operations.
◊ Thomas Jefferson National Accelerator Facility (TJNAF) is one of 17 national laboratories funded by DOE. TJNAF’s primary mission is to conduct basic research of the atom's nucleus using the unique particle accelerator known as the Continuous Electron Beam Accelerator Facility (CEBAF).TJNAF
- The CY 2020 collective TED for TJNAF was 0.607 person-rem (6.070 person-mSv), a decrease from CY 2019.
- Activities involving radiation exposure include maintenance, modification, and repair of activated components associated with the CEBAF and other ancillary activities (e.g., transport, storage, and disposal of radioactive materials).
- The closure of TJNAF for several months due to the COVID-19 pandemic caused some reduction in dose.
◊ TJNAF
- The CY 2021 collective TED for TJNAF was 1.974 person-rem (19.740 person-mSv), an increase from CY 2020.
- Activities involving radiation exposure include maintenance, modification, and repair of activated components associated with the CEBAF and other ancillary activities (e.g., transport, storage, and disposal of radioactive materials).
- Collective TED fluctuates up or down from year to year, depending on maintenance associated with unique experimental set-ups performed in radiological areas. In CY 2021, Hall A Dump reconfiguration accounted for most of the year’s dose.
◊ TJNAF
- The CY 2022 collective TED for TJNAF was 0.854 person-rem (8.540 person-mSv), a decrease from CY 2021.
- Activities involving radiation exposure include maintenance, modification, and repair of activated components associated with the CEBAF, LERF, and other ancillary activities (e.g., transport, storage, and disposal of radioactive materials). Typically, collective TED fluctuates up or down from year-to- year, depending on maintenance associated with unique experimental set-ups performed in radiological areas; and maintenance activities and RCT surveys of Beam Enclosures.
- The 2022 collective TED value is approximately one half of the historical average at Jefferson Lab for the last 10 years. Overall, the value is consistent with doses received during stable periods of accelerator operation with some maintenance and repair activities.
◊ TJNAF
- The CY 2023 collective TED for TJNAF was 0.612 person-rem (6.120 person-mSv), a decrease from CY 2022.
- Activities involving radiation exposure include maintenance, modification, and repair of activated components associated with the CEBAF, Low Energy Recirculator Facility (LERF) and other ancillary activities (e.g., transport, storage, and disposal of radioactive materials). Typically, collective TED fluctuates up or down from year to year, depending on maintenance associated with unique experimental set-ups performed in radiological areas; and maintenance activities and RCT surveys of Beam Enclosures.
- The 2023 collective TED was primarily attributed to work in the vicinity of activated cryo-modules in the CEBAF and radiation surveys that supported experiments with significant residual radioactivity in experimental halls.
◊ TJNAF
- The CY 2024 collective TED for TJNAF was 0.451 person-rem (4.510 person-mSv), a decrease from CY 2023.
- Activities involving radiation exposure include maintenance, modification, and repair of activated components associated with the Continuous Electron Beam Accelerator Facility (CEBAF), Low Energy Recirculator Facility (LERF), and other ancillary activities (e.g., transport, storage, and disposal of radioactive materials). Typically, collective TED fluctuates up or down from year to year, depending on maintenance associated with unique experimental set-ups performed in radiological areas.
- The CY 2024 collective TED was primarily related to maintenance on beam dump systems, and routine radiological protection support work. Dose can be attributed primarily to the need to perform work in the vicinity of activated cryo-modules in the CEBAF accelerator, and radiation surveys that supported experiments with significant residual radioactivity in experimental Halls.
◊ The Uranium Mill Tailings Remediation Action Project (UMTRA) site is located approximately 3 miles northwest of Moab in Grand County, Utah, and includes a former uranium-ore processing facility. The site encompasses 480 acres, of which approximately 130 acres are covered by a uranium mill tailings pile. The UMTRA Project ships four trainloads of tailings to the Crescent Junction Disposal Site each week. The trains contain 144 containers of approximately 40 tons each, or a total of 23,040 tons of tailings per week. Tailing shipments began in April 2009 and are expected to continue through CY 2034.UMTRA
- The collective TED for CY 2020 was 10.604 person-rem (106.040 person-mSv) and represented a 9 percent increase from CY 2019.
- Activities involving radiation exposure include maintenance; erosion control measures; tailings excavation and conditioning; loading tailings into containers and transporting to the rail beach; ground water remediation; and health and safety oversight.
- The increase in dose was attributed to a 50% greater (on average) concentration of radium-226 in the excavated mill tailings and additional time spent in the contamination area training new employees.
9% UMTRA
- The collective TED for CY 2021 was 7.836 person-rem (78.360 person-mSv) and represented a 26 percent decrease from CY 2020.
- Activities involving radiation exposure include maintenance; erosion control measures; tailings excavation and conditioning; loading tailings into containers and transporting to the rail beach; ground water remediation; and health and safety oversight.
- Reduction in dose can be attributed to a 10 percent decrease in the quantity of tailings shipped.
-26% UMTRA
- The collective TED for CY 2022 was 4.765 person-rem (47.650 person-mSv) and represented a 39 percent decrease from CY 2021.
- Activities involving radiation exposure include maintenance; erosion control measures; tailings excavation and conditioning; loading tailings into containers and transporting to the rail beach; ground water remediation; and health and safety oversight.
- The project continues to operate on a regular schedule of four trains per week.
-39% UMTRA
- The collective TED for CY 2023 was 8.905 person-rem (89.050 person-mSv) and represented a 87 percent increase from CY 2022.
- Activities involving radiation exposure include maintenance; erosion control measures; tailings excavation and conditioning; loading tailings into containers and transporting to the rail beach; ground water remediation; and health and safety oversight.
- The project continues to operate on a regular schedule of four trains per week.
87% UMTRA
- The collective TED for CY 2024 was 7.836 person-rem (78.360 person-mSv) and represented a 12 percent decrease from CY 2023.
- The Moab UMTRA site is entering the final stages of moving residual radioactive material (RRM) from the Moab site and placing it in the final holding cell 30 miles north, near Cresent Junction, Utah. The source term has been significantly reduced and, as a result, the site has moved to the use of annual dosimeters.
- Using the annual dosimeters did increase readings in our 5–10 mrem numbers, but that is attributed to the longer time of exposure and background. We are currently on track to have all 16 million tons of RRM placed in Cresent Junction by end of Fiscal Year 2024. At that time, we will reevaluate the necessity of and/or reduction of monitoring our workers going forward.
-12% The Waste Isolation Pilot Plant (WIPP) is located in the Chihuahuan Desert near Carlsbad, New Mexico. This DOE facility safely disposes of the nation's defense-related transuranic (TRU) radioactive waste. WIPP began disposal operations in March 1999.WIPP
- The collective TED for CY 2020 was 1.130 person-rem (11.300 person-mSv), which represented a slight increase from 2019 (1.113 person-rem [11.130 person-mSv]).
- Activities involving radiation exposure include handling and processing of transuranic waste for storage; and managing long-term repository operations.
- All doses received were from routine activities associated with the disposal of TRU waste.
2% WIPP
- The collective TED for CY 2021 was 1.283 person-rem (12.830 person-mSv), which represented a slight increase from 2020 (1.130 person-rem [11.300 person-mSv]).
- Activities involving radiation exposure include handling and processing of transuranic waste for storage; and managing long-term repository operations.
- All doses received were from routine activities associated with the disposal of TRU waste.
14% WIPP
- The collective TED for CY 2022 was 0.449 person-rem (4.490 person-mSv), which represented a slight increase from 2021 (1.283 person-rem [12.830 person-mSv]).
- Activities involving radiation exposure include handling and processing of transuranic waste for storage; and managing long-term repository operations.
- The dose decreased 65 percent in CY 2022. All doses received were from routine activities associated with the disposal of TRU waste.
◊ WIPP
- The collective TED for CY 2023 was 0.163 person-rem (1.630 person-mSv), which represented a slight decrease from 2022 (0.428 person-rem [4.280 person-mSv]).
- Activities involving radiation exposure include handling and processing of transuranic waste for storage; and managing long-term repository operations.
- The dose decreased 64 percent in CY 2023. All doses received were from routine activities associated with the disposal of TRU waste.
◊ WIPP
- The collective TED for CY 2024 increased slightly to 0.268 person-rem (2.680 person-mSv), from 0.163 person-rem [1.630 person-mSv]) in 2023.
- Activities involving radiation exposure include handling and processing of TRU waste for storage; and managing long-term repository operations.
- A total of 470 shipments were completed in 2024, compared to 323 in 2023. Although operational tempo increased, the overall TED levels remained well below regulatory limits.
◊ The West Valley Demonstration Project (WVDP) is a unique operation within DOE and came into being through the WVDP Act of 1980. The Act requires DOE to be responsible for solidifying the high-level waste and disposing of waste created by the solidification and decommissioning of the facilities used in the process. The land and facilities are not owned by DOE; rather, the project premises are the property of the New York State Energy Research and Development Authority (NYSERDA) and represent only 200 acres of the larger Western New York Service Center, which is approximately 3,300 acres, also owned by NYSERDA. After DOE's responsibilities under the Act are complete, the Act requires that the premises be returned to New York State.WVDP
- The collective TED for CY 2020 was 8.868 person-rem (88.680 person-mSv), which represented a 57 percent decrease from CY 2019.
- Activities involving radiation exposure include facility Disposition; deactivation work in the main plant process building (MPPB); and radiological control technicians providing support for facility disposition activities.
- The 2020 overall dose decreased from the previous year due primarily to fewer manned-entries in high dose rate areas in the MPPB as a result of COVID-19-imposed restrictions on operations.
-57% WVDP
- The collective TED for CY 2021 was 12.145 person-rem (121.450 person-mSv), which represented a 37 percent increase from CY 2020.
- Activities involving radiation exposure include facility disposition; deactivation work in the main plant process building (MPPB); and radiological control technicians providing support for facility disposition activities.
- Majority of dose was incurred during deactivation work in the MPPB; and return to work following COVID-19 imposed restrictions and the performance of complex hands-on work in an area exhibiting very high radiation levels.
37% WVDP
- The collective TED for CY 2022 was 12.946 person-rem (129.460 person-mSv), which represented a 7 percent increase from CY 2021.
- Activities involving radiation exposure include facility disposition; deactivation work in the main plant process building (MPPB); and radiological control technicians providing support for facility disposition activities.
- The performance of complex hands-on work in an area exhibiting very high radiation levels that could not be reduced through conventional ALARA work strategies started in CY 2021, continued through most of CY 2022.
7% WVDP
- The collective TED for CY 2023 was 7.734 person-rem (77.340 person-mSv), which represented a 40 percent decrease from CY 2022.
- Activities involving radiation exposure include facility disposition; waste container packaging and handling; and demolition monitoring and support activities.
- Cessation of in-facility deactivation resulted in a reduction of doses to facility disposition and associated support groups, including Radiological Controls; and waste operations exposure increases incurred due to the significant volume of demolition debris waste handling and processing of high activity legacy waste streams.
-40% WVDP
- The collective TED for CY 2024 was 8.664 person-rem (86.640 person-mSv), which represented a 12 percent increase from CY 2023.
- Activities involving radiation exposure include equipment operators and waste management personnel supporting facility demolition and waste loadout; facility disposition; waste container packaging and handling; and non-demolition monitoring and support activities.
- During CY 2024, nearly half of the total dose incurred was attributed to the demolition of the Main Plant Process Building.
12% Totals 750.096 0% 826.474 10% 893.125 8% 949.385 6% 926.843 -2% - Note: Bold and boxed values indicate the greatest value in each column.
- ◊ The percentage change from the previous year is not shown because it is not meaningful when the site collective dose is less than 1 person-rem (10 person-mSv).
- * Includes service center personnel from smaller facilities not associated with a DOE site.
Observations
During 2024
Increases in the dose and number of individuals with measurable dose were the result of increased activities involving radioactive materials, particularly at the DOE sites that comprise the majority of DOE collective dose.
- DOE facilities continued to comply with DOE dose limits and ACL and worked to minimize exposure to individuals.
- Although the number of monitored individuals continued to increase post-COVID, the percentage of individuals with measurable dose decreased slightly from 22 percent in CY 2023 to 19 percent in CY 2024.
- The collective TED for transients decreased by 27 percent from 29.61 person-rem (296.1 mSv) in CY 2023 to 21.6 person-rem (216 person-mSv) in CY 2024.
- The number of individuals with measurable dose decreased by 12 percent from a value of 18,473 in CY 2023 to a value of 16,308 in CY 2024.
- The collective TED decreased at DOE by 2 percent from 949.4 person‑rem (9,494 person‑mSv) in CY 2023 to 926.8 person-rem (9,268 person-mSv) in CY 2024.
Over the past 5 years
In CY 2020, the collective TED for DOE decreased by less than 1 percent or 4 person-rem (40 person-mSv). Additionally, the majority (62 percent) of DOE facilities cited the COVID-19 pandemic as limiting operational activities in CY 2020. In CY 2021, the number of facilities citing the COVID-19 pandemic as limiting operational activities decreased from 62 percent to 53 percent. With the increase in the number of monitored individuals post-COVID, the percentage of individuals with measurable dose decreased to 22 percent in CY 2022 from 25 percent in CY 2021. In CY 2023, the collective TED increased by 6 percent from CY 2022, as 17 of the 33 sites reported increases in collective TED.
- For 3 of the past 5 years, the collective dose was above the 5-year average of 869.2 person-rem.
- For CY 2024, 52 percent of the DOE workforce was monitored for radiation dose, and 19 percent of monitored individuals received a measurable dose.
- The number of individuals with measurable dose decreased 6 percent (decreased by 950 individuals) over the past 5 years.
- The collective TED increased by 24 percent (increased by 123.4 person-rem) from CY 2020 to CY 2024.
Historical perspective
The average and collective dose at DOE facilities has experienced a dramatic (89 percent) decrease coinciding with the end of the Cold War era, due to:
- The DOE mission shifts from weapons production to stabilization, waste management, and environmental remediation activities;
- Consolidation and remediation of facilities across the complex to meet the new mission; and
- Improved regulations with an increased focus on ALARA practices and risk reduction.
Historical perspective
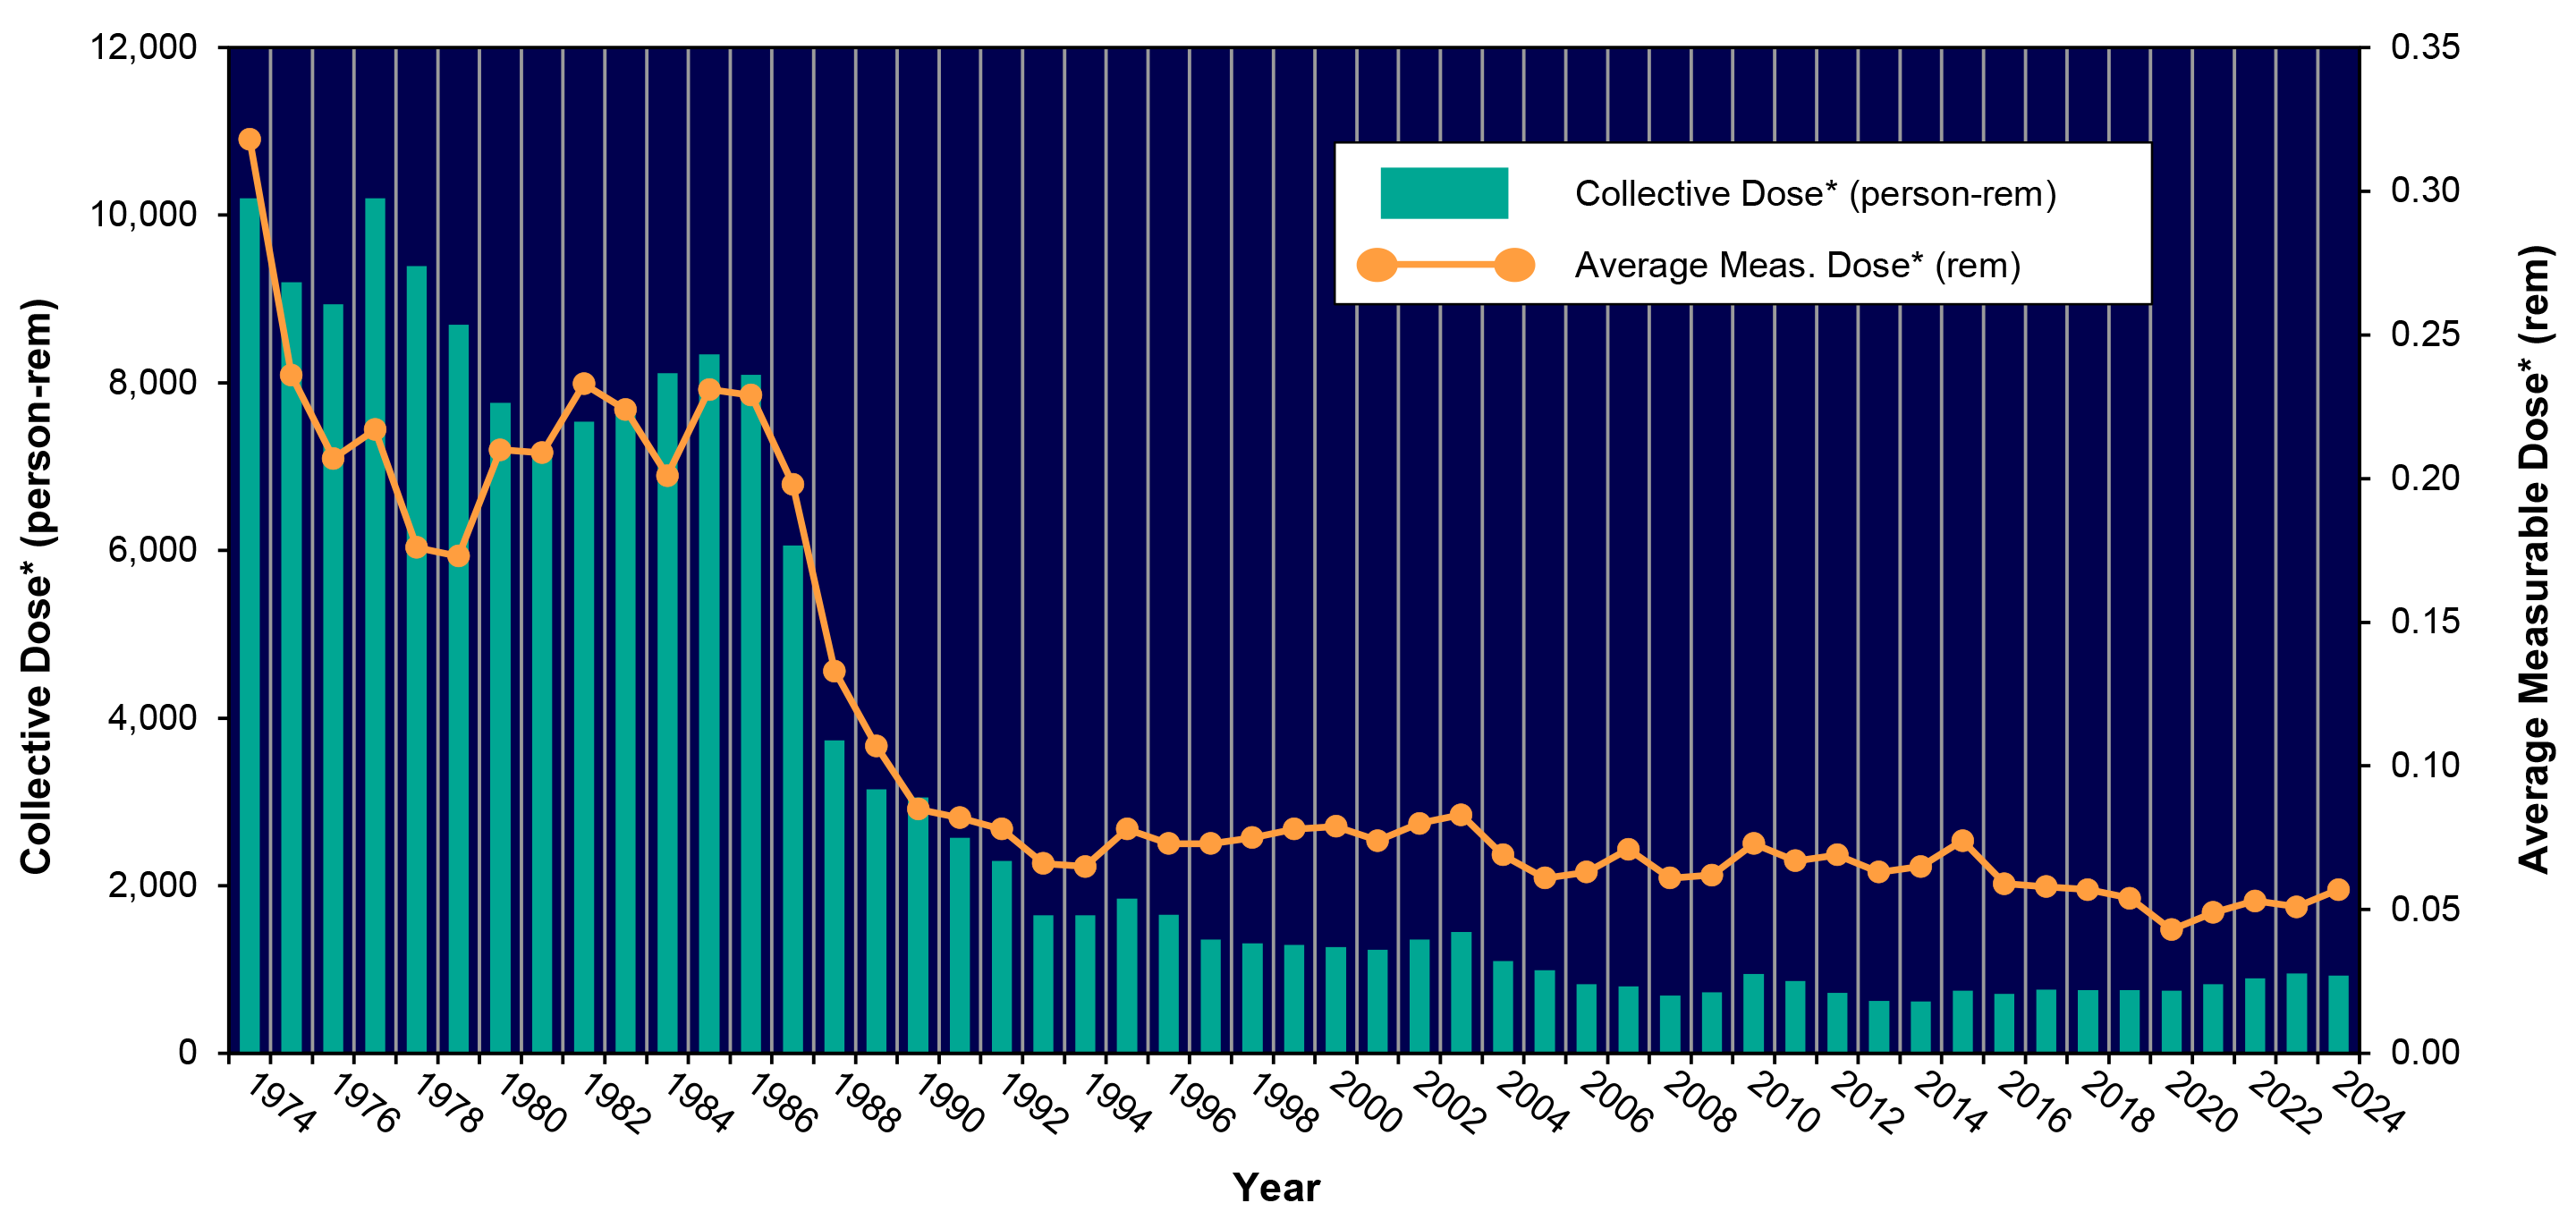
1974
Policy
- The Federal Administration Act of 1974 is signed, replacing the Federal Energy Office with the Federal Agency Administration.
- Energy Research and Development Agency (ERDA) and Nuclear Regulatory Commission (NRC) created by Energy Reorganization Act of 1974.
1975
Sites
- ERDA replaces AEC to manage the Hanford site. Expansion of the gaseous diffusion plant capability at Oak Ridge Operations Office.
- Major reactor plant modification for installation of the Light Water Breeder Reactor (LWBR) core at the Shippingport Atomic Power Station.
Geopolitical
- Atomic Energy Commission (AEC) Formally Split into Energy Research and Development Agency (ERDA) and NRC.
- NRC Assumes AEC functions.
1976
Geopolitical
- China conducts an atmospheric test (impacting the United States with environmental contamination issues).
1977
Sites
- DOE assumes control of the Hanford site from ERDA.
Policy
- The Department of Energy Organization Act is signed, abolishing the Federal Energy Administration and ERDA.
- ERDA becomes the Department of Energy.
- James R. Schlesinger sworn in as first Secretary of Energy.
Geopolitical
- Publication of International Commission on Radiological Protection (ICRP) Report No. 26, Recommendations of the ICRP.
1979
Sites
- Three DOE contractor employees at three separate facilities received whole-body dose equivalents greater than 5 rems during 1979.
Geopolitical
- Three Mile Island {TMI) Reactor Accident.
- Publication of ICRP Report 30, Limits for Intakes of Radionuclides by Workers.
1981
Policy
- Reagan Administration announces a nuclear energy policy that anticipates the establishment of a facility for the storage of high-level radioactive waste and lifts the ban on commercial reprocessing of nuclear fuel.
1982
Policy
- Congress passes the Nuclear Waste Policy Act (NWPA).
1984
Geopolitical
- Radon gas problem identified in Pennsylvania (Reading Prong).
1986
Sites
- Gaseous Diffusion Plant Shut Down (K-25).
- Construction of Saltstone at SRS begins.
Policy
- DOE Laboratory Accreditation Program (DOELAP) begins.
- DOE Policy Change from Statistical Summary Reporting to Individual Dose Records for Each Worker — 1986-1987.
- DOE Order 5480.11, Radiation Protection for Occupational Workers, in effect — 1985-1989.
- Internal radionuclide intakes are converted to internal doses and results reported using Annual Effective Dose Equivalent (AEDE) methodology — 1985-1989.
Geopolitical
- Chernobyl Nuclear Reactor Meltdown Occurred.
1987
Sites
- N-Reactor Shut Down (RL).
- C-Reactor Shut Down (SRS).
- PUREX & UO3 Plants Shut Down (RL).
Policy
- DOE Policy Change from Statistical Summary Reporting to Individual Dose Records for Each Worker — 1986-1987.
- Issue of EPA Federal Guidance Policy Recommendations, Radiation Protection Guidance to Federal Agencies for Occupational Exposure.
- Publication of National Council on Radiation Protection & Measurements 91, Recommendations on Limits for Exposure to Ionizing Radiation.
- DOE Order 5480.11, Radiation Protection for Occupational Workers, in effect — 1985-1989.
- Internal radionuclide intakes are converted to internal doses and results reported using Annual Effective Dose Equivalent (AEDE) methodology — 1985-1989.
Geopolitical
- Intermediate-Range Nuclear Forces Treaty - December
1988
Sites
- K-, L-, & P-Reactors Shut Down (SRS).
- Bulk Shielding Reactor Shut Down (ORNL).
Policy
- DOE promulgates DOE Order 5480.11, Radiation Protection for Occupational Workers.
- EPA publishes Federal Guidance Report No. 11 (Environmental Protection Agency 520/1-88-020), Limiting Values of Radionuclide Intake and Air Concentration and Dose Conversion Factors for Inhalation, Submersion, and Ingestion.
- DOE Order 5480.11, Radiation Protection for Occupational Workers, in effect — 1985-1989.
- Internal radionuclide intakes are converted to internal doses and results reported using Annual Effective Dose Equivalent {AEDE) methodology — 1985-1989.
Geopolitical
- DOE reports no DOE reactor is producing Tritium for nuclear weapons.
1989
Sites
- Plutonium Fabrication Plant (PFP) Shut Down (RFETS).
Policy
- DOE Implements both 1987 Federal Guidance and NCRP 91 in Order 5480.11.
- November — Office of Environmental Restoration and Waste Management Established.
- DOE Order 5480.11, Radiation Protection for Occupational Workers, in effect — 1985-1989.
- Internal radionuclide intakes are converted to internal doses and results reported using Annual Effective Dose Equivalent (AEDE) methodology — 1985-1989.
1990
Sites
- High Pressure Tritium Facility Shut Down (LANL).
Geopolitical
- Publication of ICRP 60, 1990 Recommendations of the International Commission on Radiological Protection.
1991
Sites
- Saltstone Waste Processing Begins (SRS).
Geopolitical
- Strategic Arms Reduction Treaty Signed.
1993
Sites
- Idaho Chem. Processing Plant (ICPP) Work Scope Reduced (INEL).
- Tower Shielding Reactor Shut Down (ORNL).
Policy
- DOE RadCon Manual (DOE/EH-0256T) introduced.
- Implementation of RadCon Manual — 1992-1993.
Geopolitical
- DOE Secretary of Energy Testifies that the U.S. is Not Building Any Nuclear Weapons.
1993
Policy
- Implementation of RadCon Manual — 1992-1993.
- Publication of NCRP Report 116, Limitation of Exposure to Ionizing Radiation.
- EPA publishes Federal Guidance Report No. 12 (EPA 402-R-93-001), External Exposure to Radionuclides in Air, Water, and Soil.
Geopolitical
- Congress terminates the Superconducting Super Collider (SSC) project.
1994
Policy
- 10 CFR Part 835, Occupational Radiation Protection, becomes effective.
1995
Sites
- Increased dose due to increased work in the production of power sources for NASA at LANL.
- Dose increased due to increased days of operation and intensity of AGS accelerator; and maintenance surveys conducted on aging equipment at BNL.
- Two key ICPP facilities were deactivated at Idaho.
- Increased dose due to increased activities involved with decontamination and decommissioning; and the processing of potentially unstable residues for safe storage at Rocky Flats.
- Increased dose due to elimination of spent nuclear fuel storage at K Basins and operation of the mixed low-level waste evaporator associated with tank farms at Hanford.
- Defense Waste Processing Facility was restarted near the end of 1995 at Savannah River.
Policy
- International Atomic Energy Agency publishes "International Basic Safety Standards for Protection Against Ionizing Radiation and for the Safety of Radiation Sources" (known as BSS Safety Standards, Safety Series 115-1).
1996
Sites
- Vitrification in glass canisters of highly radioactive liquid wastes begins at the West Valley Demonstration Project.
- Collective dose was significantly reduced due to the installation of the perimeter shielding and completion of the "clean and coat" project at Hanford.
- Reduction in exposure due to completion of major radiological work performed at the ICPP and the deactivation of two key facilities at the ICPP at the Idaho Site.
- Doses at TA-55 were reduced due to ALARA activities at LANL.
- Doses increased primarily due to activities in support of the restart of the Y-12 Plant involving enriched uranium operations at Oak Ridge.
- Environmental restoration activities increased at Y-12, ORNL, and K-25 at Oak Ridge.
- Doses increased due to increased activities and decontamination and decommissioning cleanup at Rocky Flats.
- Activities in spent fuel storage areas decreased dramatically with shutdown of reactors at Savannah River.
- There was one individual in 1996 who received a dose in excess of the 5 rems TED limit due to an unanticipated intake of plutonium at the Savannah Site.
- Activities involving plutonium at LANL decreased in 1996, which resulted in decreased neutron dose by 30%.
Policy
- 10 CFR Part 835 Full Compliance required.
- DOE Order 5480.11 cancelled and RadCon Manual becomes "non-mandatory" following issuance of DOE Notice 441.1, Radiological Protection for DOE Activities.
1997
Sites
- One individual received a dose in excess of the 5 rems (50 mSv) TED limit at LANL.
- Decreases in the collective dose were due to reductions in such activities as materials stabilization, maintenance, and the completion of several key projects at Savannah River, Idaho, BNL, and Oak Ridge.
- Increased plutonium recovery activities.cleanup and repackaging at Rocky Flats, LANL, and Savannah River.
- Production of heat sources for deep-space missions, which was completed in 1997 at LANL.
- Groundbreaking ceremony for the National Ignition Facility (NIF) at LLNL.
- Plutonium Uranium Extraction Facility (PUREX) at Hanford deactivated a year ahead of schedule.
1998
Sites
- 1997 to 1998 - increase in uranium operations in Oak Ridge in support of the restart at Y-12.
- Shutdown of several facilities, the completion of several key projects, and ALARA Initiatives at Hanford, Los Alamos, Idaho, and Brookhaven.
- DOE announces it will dispose of defensegenerated transuranic waste at Waste Isolation Pilot Plant.
- Uranium Mill Tailings Remedial Action Project ends with remediation of the 22nd and final site at Maybell, Colorado.
- SRS announced as the site of a plant to disassemble pits from nuclear weapons and convert the recovered metal to an oxide.
- NIF target chamber dedicated at the LLNL.
Policy
- 10 CFR 835 Amendment.
- DOE-STD-1098-2008 (DOE Standard Radiological Control).
1999
Sites
- One individual received a dose in excess of the 5 rems (50 mSv) TEDE limit at SRS.
- WIPP receives 1st waste shipment.
- Aggressive ALARA programs at Savannah River, Los Alamos, and Idaho.
- Decontamination campaign at SRS to reduce source term.
- Improved work practices, and a delay in several projects at Idaho due to an accident in 1998 which resulted in corrective actions that affected the work control system.
- Workers at the Paducah Gaseous Diffusion Plant (PGDP) unknowingly exposed to plutonium contained in uranium sent from Hanford and Savannah River for recycling between 1952 and 1976.
- High Flux Beam Reactor (BNL) will be closed permanently.
- Ground breaking at ORNL for the Spallation Neutron Source (SNS).
Policy
- RadCon Manual reissued as Radiological Control Standard (RCS).
- EPA publishes Federal Guidance Report No. 13 (EPA 402-R-99-001), Cancer Risk Coefficients for Environmental Exposure to Radionuclides: Updates and Supplements.
- Secretary Richardson proposes legislation to compensate current and former workers at uranium enrichment facilities for cancers resulting from exposure to radioactive contaminants.
2000
Sites
- Three intakes of plutonium at LANL that were in excess of the 5 rems (50 mSv) DOE annual limit.
- One individual received exactly 2 rems (20 mSv) at LANL.
- Reduction of source material and lowering of ambient dose rates at Rocky Flats.
- Change in the biokinetic models used to determine internal dose from uranium intakes at the Oak Ridge Y-12 facility.
- Reduction in operational activities during corrective actions following the plutonium intake event at LANL.
- Fast Flux Test facility (Hanford) to be closed permanently.
Policy
- Secretary Richardson expands proposal to compensate more than 3,000 current and former workers with a broad range of work-related illnesses.
2001
Sites
- One exposure in excess of the DOE Administrative Control Level (ACL) of 2 rems at LANL.
- Reduction in radioactive material from repackaging and shipping activities at Rocky Flats and Hanford.
2002
Sites
- One individual received in excess of the 50 rems (500 mSv) annual extremity limit at LANL.
- Increase in the number of hours of radiological work performed at Rocky Flats.
- Increased processing of spent nuclear fuel in K-Basins at Hanford.
- Increased work on pit manufacturing, Pu-238 fuel and heat source work, nuclear material processing, nuclear materials science, pit disassembly, and associated support at LANL.
- Work begins on new high-level waste vitrification plant at Hanford.
- 563rd and final shipment of TRU waste from INEL received atWIPP.
- WVDP successfully completes nation's first radioactive waste vitrification program.
Policy
- 25th anniversary of DOE formation.
- DOE, EPA, and State of Washington agree to accelerate cleanup at Hanford.
- DOE, EPA, and State of South Carolina agree to accelerate cleanup at SRS.
- DOE, EPA, and State of Tennessee agree to accelerate cleanup of Oak Ridge sites.
- DOE informs State of South Carolina that shipments of plutonium to SRS will begin.
2003
Sites
- Two exposures in excess of the DOE 5 rems (50 mSv) annual TED limit at LANL.
- Thermal stabilization and repackaging of plutonium-bearing materials, processing of spent fuels, and accelerated cleanup at Hanford.
- Resumption of processing of radioactive material, special programs, and accelerated facility closure and waste processing activities at Savannah River.
- Work activities associated with the building 9204-4 Cleanup Project at Oak Ridge.
- TVA Off-Specification Fuel repackaging project at Oak Ridge.
- Processing of more materials containing americium, an upgrade to the material storage vault, and the decontamination and decommissioning of the Omega West reactor at LAN L.
- SRS downblends HEU into LEU and makes first shipment to Nuclear Fuel Services (NFS), Erwin, TN.
- Rocky Flats makes final shipment of nuclear weapons-usable material from the site.
Policy
- On August 19, 2003, DOE approved and issued the revised DOE Order 231.1A.
2004
Sites
- One individual received in excess of the DOE ACL limit at Hanford.
- One individual received in excess of the DOE ACL limit at Rocky Flats.
- Rocky Flats radioactive source material was shipped off site for disposal.
- Completion of thermal stabilization and repackaging of plutonium-bearing materials at Hanford.
- Deactivation & decommissioning activities at the Plutonium Finishing Plant at Hanford.
- Decreased number of tank farm entries at Hanford.
- Completion of work, including de-inventory of a number of facilities at Savannah River.
- Suspension of nonessential operations at LANL during the second half of 2004.
- Decrease in the isotope production work that took place at ORNL during 2004.
Policy
- The DOE Manual 231.1-1 A, which details the format and content of reporting radiation exposure records to DOE, was approved on March 19, 2004.
2005
Sites
- Closure of Rocky Flats (cleanup considered complete).
- Completion of several projects ahead of schedule at plutonium facilities at the Savannah River Site.
- Decrease in the amount of work performed for the TVA Off-Specification Fuel Repackaging Project at the Oak Ridge Y-12 NSC.
- Decrease in dose as a result of the completion of plutonium stabilization activities at the Plutonium Finishing Plant at Hanford.
2006
Sites
- Delayed start-up of the Saltstone process at SRS.
- ALARA controls to reduce direct handling of TRU drums at the SRS.
- Reduction in the amount of work performed associated with the TVA off-specification fuel repackaging and other special projects at the Oak Ridge Y-12 NSC.
- Decrease in the isotope production work that took place at ORNL during 2006 due to an outage at the HFIR for the installation of the Cold Neutron Source.
- 41 % reduction in the collective dose at the AMWTP as a result of ALARA initiatives at Idaho.
Policy
- DOE published a proposed amendment to 10 C.F.R. 835 in the Federal Register.
2007
Sites
- One individual received in excess of the DOE 5 rems limit at LANL.
- Planned activities not performed at LANL.
- Significant reduction in work during pause due to safety concerns at LANL.
- Increased awareness due to ALARA initiatives at the Advanced Mixed Waste Treatment Project at INL.
Policy
- 10 CFR 835 Amended.
Geopolitical
- Publication of ICRP 103, 2007 Recommendations of the ICRP
2008
Sites
- One individual received in excess of the DOE ACL limit at LANL.
- Same individual received in excess of the 50 rems COE limit at LANL.
- A safety-driven pause in operations at LANL.
- Reduction in dose rates and work activities at Hanford.
- Reduction in the number of samples processed and source term at Idaho.
2009
Sites
- Accelerated clean-up at Hanford made possible by the ARRA.
- Increased work at Los Alamos Neutron Science Center (LANSCE) TA-55 Plutonium Processing Facility at LANL.
- Maintenance and Decontamination and Decommissioning (D&D) work at TA-53 LANSCE Station.
- Workers performing retrieval, repackaging, and shipping of radioactive solid waste at LANL waste facilities.
- Increased D&D activities at West Valley Demonstration Project.
- Increases in production work assigned by National Nuclear Security Administration (NNSA) at Pantex Plant.
2010
Sites
- One individual received in excess of the DOE 5 rems limit at SRS.
- Increased D&D activities at Plutonium Finishing Plant.
- Increased retrieval and processing TRU waste at Hanford.
- Waste processing including higher dose waste drums and decommissioning at Savannah River Site.
- Isotope processing and cleanup and waste disposal at Oak Ridge.
- Increased decommissioning and decontamination at Idaho.
- Increased manufacturing and related weapons work, processing and shipping solid waste, and maintenance activities at LANL.
Policy
- Effective Implementation Date for the 2007 10 CFR 835 Amendments.
- Under the American Recovery & Reinvestment Act of 2009 (ARRA), funding for cleanup and environmental efforts resulted in a significant increase in collective dose in 2010.
2011
Sites
- Implementation of handheld x-ray devices reduced amount of rework at Savannah River Site.
- Improvements in planning, better configuration in waste storage, and increased worker awareness at Idaho.
- Reduction of ARRA activities at Savannah River and Hanford.
- Programs that encourage workers to track their own dose at Idaho.
Policy
- 10 CFR 835 Revision.
- Incorporated the update of Appendix C, Derived Air Concentration (DAC) for Workers from External Exposure During Immersion in a Cloud of Airborne Radioactive Material.
Geopolitical
- March 11, 2011 — Fukushima Event.
2012
Sites
- Increased worker awareness and planning at the Idaho Site.
- Decrease in the number of targeted waste drums processed at the Idaho Site's Accelerated Retrieval Project.
- Overall reduction of D&D activities and TRU retrieval at Hanford Site.
- Solid Waste Management Facility's use of specialty tools and techniques to reduce exposure time.
Policy
- Decreased ARRA-funded activities.
- UNSCEAR Report - Fukushima 2012. Supplement No. 46 issued.
- WHO report (2012) issued.
2013
Sites
- A significant portion of LANL dose was accrued by workers performing retrieval, repackaging, and shipping of radioactive solid waste at TA-50 and TA-54 waste facilities.
- Reductions at Oak Ridge were achieved through an overall decrease in radworker population throughout the complex and an approximate 2-month decrease in production work in preparation for the government shutdown during the sequestration in October 2013.
- Significant decreases at SRS are attributed to ALARA initiatives that were employed and a host of budget issues that arose during the year.
- The largest contributors to Hanford dose activities were glove box removal at PFP, Tank Farm activities, D&D, waste treatment, storage and handling.
2014
Sites
- Curtailed work with solid waste at LANL due to the contamination release event at WIPP and its relation to LANL waste packaging.
- Increased training exercises for the Homeland Security/Defense Threat Reduction Agency at INL.
- Waste Management group of the ICP started the Sodium Distillation System (SDS) process in the 3rd quarter. This process included cleaning of the slide gate and replacing, installing and removing SOS equipment.
- Implemented the tungsten tote carrier system at SRS to replace the doorstop system for transporting high radiation samples.
- Completed SRNL Cell Window replacements at SRS.
- Completed installation of the Raster beam line at BNL.
2015
Sites
- At Idaho National Laboratory, exposure activities performed included work at the Advanced Test Reactor Complex, including experiment system operations, plant maintenance modifications, routine ATR power operations, routine ATR outage operations, and Research and Development Operations/Laboratory Support.
- At SPRU, increased cleanup activities at SPRU resulted in a 642 percent increase in collective TED from 2014 to 2015.
- In 2015, WVDP dose was attributed to demolition preparation work in the liquid waste cell, all three extraction cells, the off gas cell/off gas blower room, sample storage cell, and the vitrification facility.
- WIPP continued decontamination efforts in the WIPP underground as well as resumption of limited activities.
- At Sandia National Laboratory, there was a decrease in the number of waste and material disposition campaigns at the auxiliary hot cell facility and experiments at the annular core research reactor.
- At PPPL, there was reduced access to the NSTX-U test cell during the first half of 2015.
2016
Sites
- At Savannah River Site, an increase was due to remediating a 1950s era underground liquid waste storage tank, completing the K Area complex battery change on the radio frequency tamper indicating device, beginning down-blend operations for plutonium for eventual storage at the Waste Isolation Pilot Plant (WIPP), and resuming process operations in portions of the H Canyon to allow for continued spent nuclear fuel dissolution. In addition, Savannah River Nuclear Solutions (SRNS) personnel began cleanup of the building used to produce fuel for the deep space missions such as the Galileo space probe to Jupiter.
- WVDP dose experienced an increase due to the facility disposition demolition preparation work in the liquid waste cell, all three extraction cells, the off gas cell/off gas blower room, sample storage cell, and the vitrification facility. The high-level waste department prepared the equipment decontamination room, vitrification tunnel, and the chemical process cell crane room for high-level waste canister movements and the removal of the first three casks containing the vitrified high-level waste. The waste operations department activities supported waste packaging and movements onsite and the preparation of the remote handling waste facility operations.
- At Sandia National Laboratory, there was a decrease that was attributed to the no waste and material disposition campaigns occurring at the Auxiliary Hot Cell Facility (AHCF) and the Annular Core Research Reactor (ACRR) not operating for a large part of the year.
- At PPPL, a decrease was reported. The primary reason for this change was the shortened run-period of PPPL’s primary experiment, the NSTX-U test cell, after it went into extended maintenance. There also was a conversion from monthly to quarterly dosimetry for a portion of 2016.
2017
Sites
- The collective TED increased at LANL, SRS and Oak Ridge. The increase at LANL was due largely to increased work activities at TA-55 plutonium facility operations which were fully resumed following the 2013 shutdown. The increase SRS can be attributed to workers engaging in work with a high potential for exposure, and at Oak Ridge, the increase in collective TED is attributed to increased project work activities at hot cell and radiochemistry facilities, and maintenance and waste handling activities at neutron research and radiochemistry facilities.
- The collective TED decreased at Hanford and Idaho. The decrease at Hanford was due to a change in work activities at the plutonium finishing plant facility (PFP). The collective TED at Idaho decreased for a variety of reasons including decreased experiment handling and shipping operations; and the installation of new engineering controls related to waste treatment efforts.
2018
Sites
- At Savannah River, the collective dose decreased by 22 percent from 2017 to 2018 as activities with a high potential for exposure were completed.
- At LANL, programmatic work at TA-55 was fully resumed and the facility was operating at increased capacity following a stand down in CY 2013.
- Beginning May 2018, solid waste handling at LANL’s TA-54 facility transitioned to a new contractor, under DOE-EM oversight.
- At ORNL, calendar year 2018 saw an increase in dose for project work at accelerator, radiochemistry, and some hot cell facilities, which was offset by a decrease in dose at the research reactor facility and other hot cell facilities.
- At INL, dose increased due to loop experiment sponsor upgrade activities associated with asbestos removal from loop piping in the 1D-N primary cubicle and emergent work to replace the 1D-N inpile tube involving high radiation work in the subpile room.
- For WVDP, the CY 2018 overall dose increased from the previous year due primarily to increased manned-entries in high dose rate areas in the Main Plant, to open air demolition activities of the Vitrification Facility and the inventorying and removal of high radiation boxes from CPC/outside storage areas into LSA-3.
- Doses at Hanford Site remained lower as there was a transition in work activities from removal to facility demolition.
- LLNL instituted a change in dosimetry issuance policy which resulted in a significant decrease in the monitored population.
- At Argonne National Laboratory, the decreases in collective TED and average measurable TED are attributed to decontamination work at the Alpha Gamma Hot Cell Facility taking less time than anticipated with lower dose rates present than previously observed during the same type of work in CY 2014.
2019
Sites
- Innovations at SRS, such as using drones in post closure areas and optimization process projects in support of K area plutonium down blend help to reduce radiological exposure.
- Fermilab had 138 planned jobs reviewed and 6 ALARA plans identified and implemented, resulting in improved accelerator performance, enhanced reliability, and better control of present and future radiation exposures.
- UMTRA added about 30 additional staff and doubled its production in CY 2019 (increasing from shipping railcars twice a week to four times a week) which attributed to the increase in dose.
2020
Sites
- The Pantex Dosimetry program experienced a failure of the thermoluminescent (e.g., TLD) reading equipment, resulting in the first 3 quarters of dosimeter readings in 2020 being processed at another facility. Dose calculations were corrected for the reader differences and a very conservative approach was utilized to ensure all dose was captured. As a result, the dose for Pantex personnel was elevated compared to prior years.
- The reduction in monitored individuals at Idaho was attributed to implementation of a dosimeter reduction campaign and Site access restrictions due to the COVID-19 pandemic.
- UMTRA had increase in dose that was attributed to a 50% greater (on average) concentration of radium-226 in the excavated mill tailings and additional time spent in the contamination area training new employees.
Geopolitical
- COVID-19 Global Epidemic
2021
Sites
- In CY 2021, there was an increase in work at TA-55, leading to an increase in the number of personnel, and subsequently, an increase in collective dose at LANL.
- Idaho began work on waste drum characterization and increased entries in the fuel storage facility and other high dose areas.
- Pantex resolved their dosimetry issue and dose levels were similar to CY 2019.
- Energy Technology Engineering Center eliminated personnel dosimeters due to no accessible radiological areas present onsite.
- UMTRA decreased the quantity of tailings shipped by 10 percent.
Policy
- DOE projects monumental emissions reduction from Inflation Reduction Act.
Geopolitical
- As the COVID-19 pandemic began to lessen, many DOE sites slowly resumed radiological work.
- Russian invasion into Ukraine
- Zaporizhzhia, Europe’s largest nuclear power plant, threatened in Russian warfare
2022
Sites
- In CY 2022, there was an increase in work at LANL TA-55, leading, to an increase in the number of personnel, and subsequently, an increase in collective dose.
- The deactivation of 235-F was completed at Savannah River, post-closure care activities performed at closed reactor facilities; and plutonium down blending in area K which was completed ahead of schedule in FY 2022.
- Work at West Valley Demonstration Project in an area exhibiting very high radiation levels that could not be reduced through conventional ALARA work strategies started in CY 2021, continued through most of CY 2022.
- At Fermi National Accelerator Laboratory (Fermilab), the majority of dose to personnel resulted from work performed during the shutdown from June 11 to November 13 of CY 2022.
Geopolitical
- Most DOE sites have resumed radiological work as the effects of COVID-19 pandemic continued to lessen.
2023
Sites
- In CY 2023, there was an atypical reduction in demand of programmatic heat source work, which contributed greatly to the observed reduction in dose at Los Alamos National Laboratory.
- Dose at Savannah River Site increased in CY 2023 as the site set a single-year record by processing nearly 3.2 million gallons of radioactive salt waste. Also, two radioactive structures in the F Tank Farm were successfully closed and grouted.
- The Portsmouth facility restarted plant operations in June 2022 with a graded restart from one operational line up to three during CY 2023 as operations returned to full production. The dose is as expected and typical for 3 lines operating.
2024
Sites
- The Surplus Plutonium Disposition Team at Savannah River Site received approval from the Department of Energy to expand down blending capabilities in the K Area Complex.
- The decrease in TED at Lawrence Livermore National Laboratory for CY 2024 was primarily due to a work pause impacting individuals expected to receive high doses.
- Hanford: Office of River Protection had a significant dose reduction in CY 2024 due to a technology change introduced in tank farm activities.
- West Valley Demonstration Project completed demolition of the Main Plain Process Building.
Geopolitical
- The US Department of Energy has released an information guide for communities considering replacing their retired or retiring coal power plants with nuclear power plants. The guide is based on a technical study that found transitioning from a coal plant to nuclear would bring local benefits including employment opportunities, increased revenues and economic activity.
- Tohuku Electric Power Company's Onagawa unit 2 is the first Japanese boiling water reactor to be restarted since the earthquake and tsunami of March 2011.
- Japan announced in April 2021 it planned to discharge water into the sea over a period of about 30 years. It started to discharge the water on 24 August 2024 and has so far completed the release of eight batches, a total of 62,400 cubic meters of water. The releases were treated by the Advanced Liquid Processing System, which removes most of the radioactive contamination, with the exception of tritium. which is currently stored in tanks on site.
Note: click on graph for detailed information