
10 Year Summary of DOE Occupational Exposure Data
Overview
A Decade of REMS
This is a 10-year summary of data collected by DOE’s Radiation Exposure Monitoring System (REMS). Data were analyzed over a ten-year period from CY 2015 – 2024. During this time period, more than 857,000 annual monitoring records representing over 208,000 unique individuals from 36 sites were monitored. Of those individuals, over 61,500 individuals (30 percent) received measurable radiation dose.
The goal of this summary is to provide a broad description of occupational radiation exposure data collected across the DOE Complex over the past 10 years using interactive graphics, and to offer explanations for trends seen in these data. The information that follows is divided into different areas that help illustrate the complex nature of the DOE mission and the relationship to occupational radiation dose.
Overview
Certain key indicators are useful when evaluating occupational radiation exposures received at DOE facilities. The key indicators are analyzed to identify and correlate parameters having an impact on radiation dose at DOE.
-
Collective TED
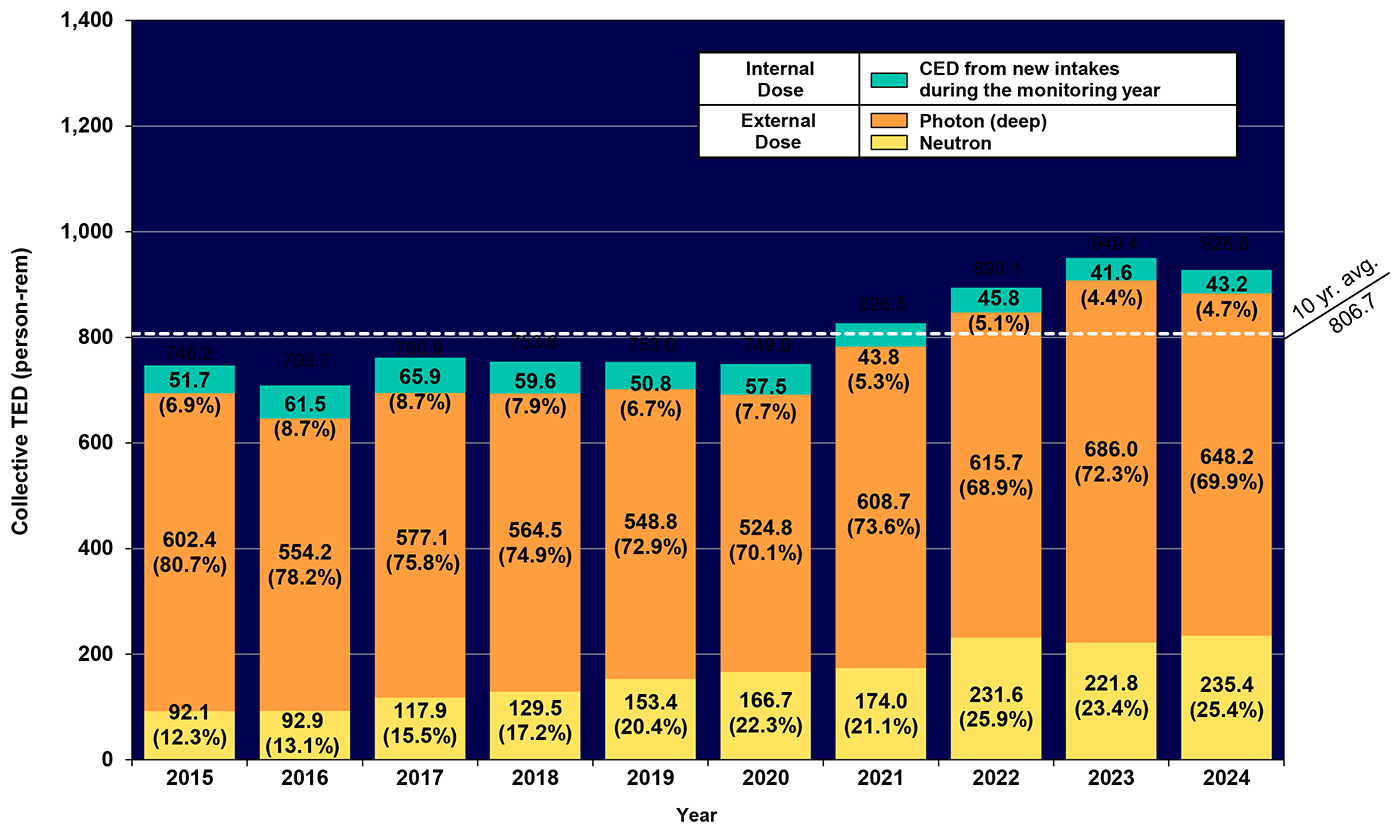
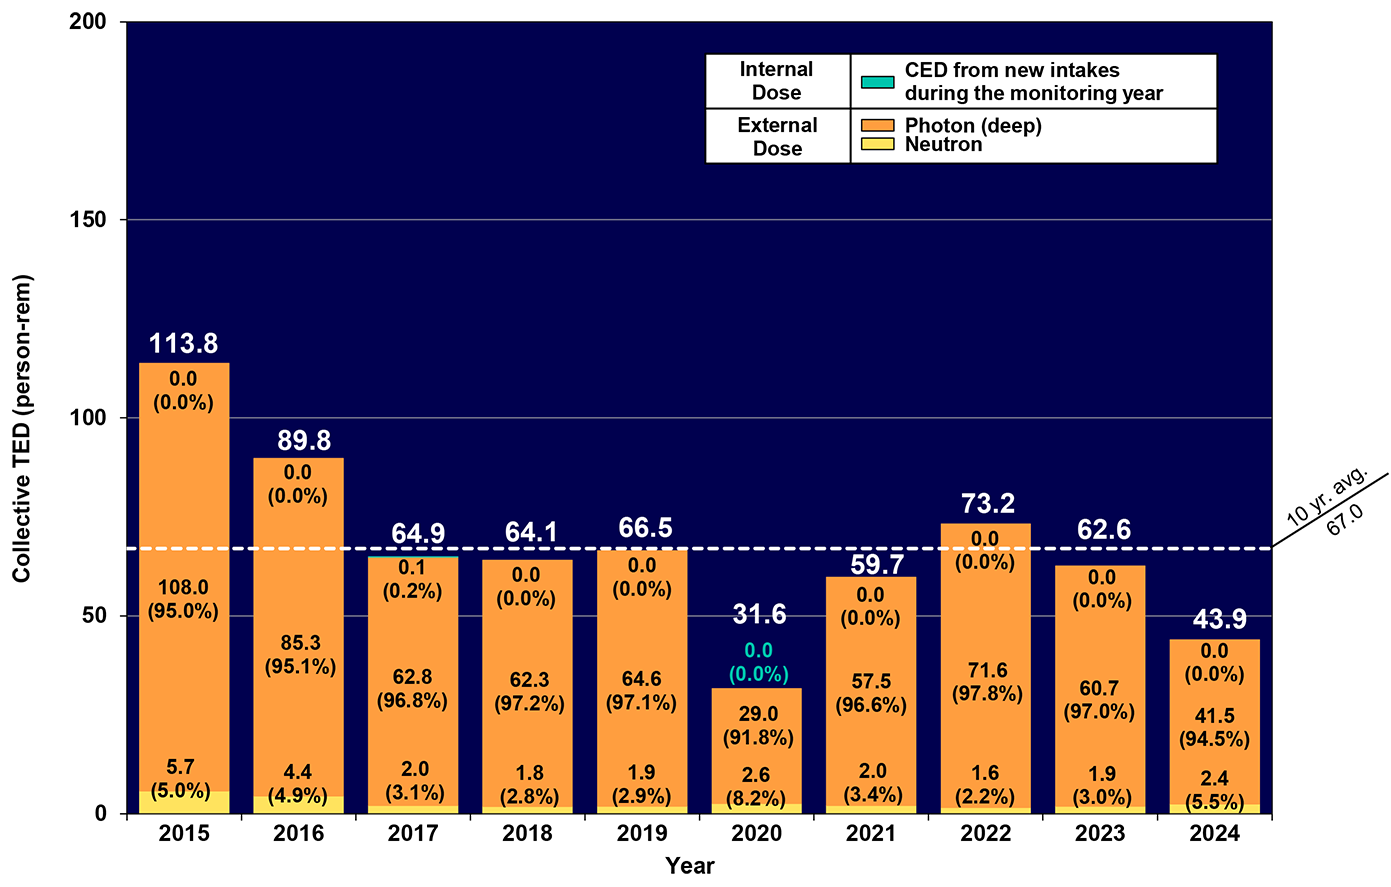
The Total Effective Dose (TED) is comprised of external and internal dose. The penetrating (deep) photon dose represents the majority of the TED.
From CY 2015 to CY 2024, there has been a 16 percent decrease in collective CED, as he collective internal dose has been steadily declining since CY 2020. The collective internal dose has been below the 10-year average of 53.1 person-rem since CY 2020. Internal dose decreased by 28 percent from CY 2020 to 2023. From CY 2023 to CY 2024, there was a 4 percent increase in collective CED. The majority of all internal dose every year (greater than 90 percent) can be attributed to uranium enrichment at the Y-12 National Security Complex in Oak Ridge. CED was the smallest component of total dose (4.4-8.7 percent) throughout the 10-year period.
Deep dose (photon) was the largest component of collective TED (68.9-80.7 percent) from CY 2015 to 2024. Increases and decreases in the deep dose, therefore, are the overall drivers in the increase and decrease in the collective TED. Deep dose has fluctuated in the past 10 years in accordance with increases and decreases in demolition and decontamination (D&D) activities, production work, and safety practices. Two of the main reasons for the overall downward trend in deep dose since CY 2006 have been the shutdown of facilities that contributed significantly to the collective deep dose in the past and completion of specific projects funded in 2009 through the American Recovery and Reinvestment Act.
Deep dose increased 16 percent in CY 2021, 1 percent in CY 2022, and 11 percent in CY 2023 likely from the resumption of activities after reduced workloads during the COVID-19 pandemic. More details are found under the Historical Overview tab of this report. From CY 2023 to CY 2024, there was a 2 percent decrease in collective TED, likely the result of the year-to-year fluctuations in radiological work at DOE sites.
Neutron dose fluctuated over the past 10 years in relation to activities at large plutonium processing facilities, primarily LANL, Hanford, and SRS. Neutron dose increased by 156 percent from CY 2015 to 2024. There was an upswing in the neutron component in CY 2019 and 2020, attributable to increased work at LANL and WIPP. In 2022 and 2023, the majority of neutron dose (72 and 79 percent, respectively) was from LANL. Neutron dose decreased by 4 percent (9.8 person-rem) from CY 2022 to 2023 but increased 6 percent (13.6 person-rem) in CY 2024. Neutron dose from CY 2015 to 2024 comprised 12.3-25.9 percent of total dose.
-
Internal Doses
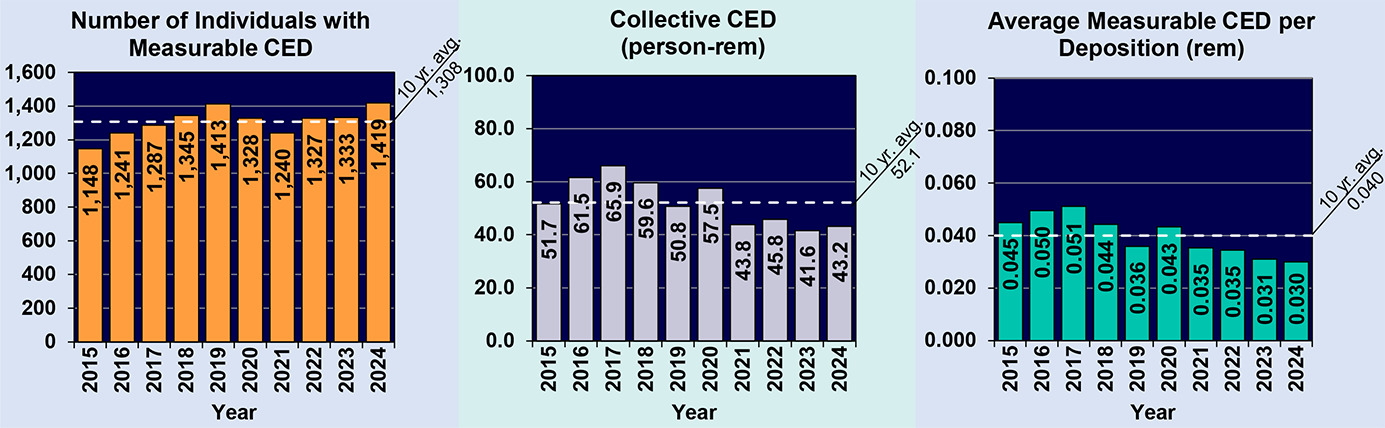
The Committed Effective Dose (CED) has decreased 16 percent over the last 10 years, ranging from 4.4 to 8.7 percent of the Collective TED. Since CY 2020, internal dose has been steadily declining, with the last four years being below the 10-year average of 52.1 person-rem.
The number of individuals with measurable committed effective dose (CED) has generally fluctuated across the DOE complex from CY 2015 to 2024. There was a 12 percent decrease in the number of individuals with measurable CED from CY 2019 to CY 2021 resulting from the COVID-era work stoppage. Overall, from CY 2015 to 2024, there has been a 24 percent increase in the number of individuals with measurable CED, mainly due to a 271 person increase in the number of individuals with measurable CED.
The collective CED has also fluctuated over the last ten years; increasing from 2015 to 2017 to a 10 year high of 65.9 person-rem and trending downward since then to a low of 43.2 person-rem in 2024. The collective CED has remained within 25 percent of the 10-year average over the past 10 years. The collective CED increased by 4 percent from 41.6 person‑rem in CY 2023 to 43.2 person-rem in CY 2024. Typically, over 90 percent of all internal doses (CED) are attributable to uranium operations at Y-12 in Oak Ridge.
The 10-year average measurable CED across the Complex was 0.040 rem. In five of the ten years between CY 2015 and 2024, the average measurable CED was above the 10-year average. From CY 2017, when the average measurable CED was 0.051 rem, the average measurable CED decreased 41 percent, reaching the lowest point (0.030 rem) during the 10-year period in CY 2024.
-
Average Measurable TED
Note: roll the cursor over the bar for each year to see the sites with the minimum and maximum average measurable dose.
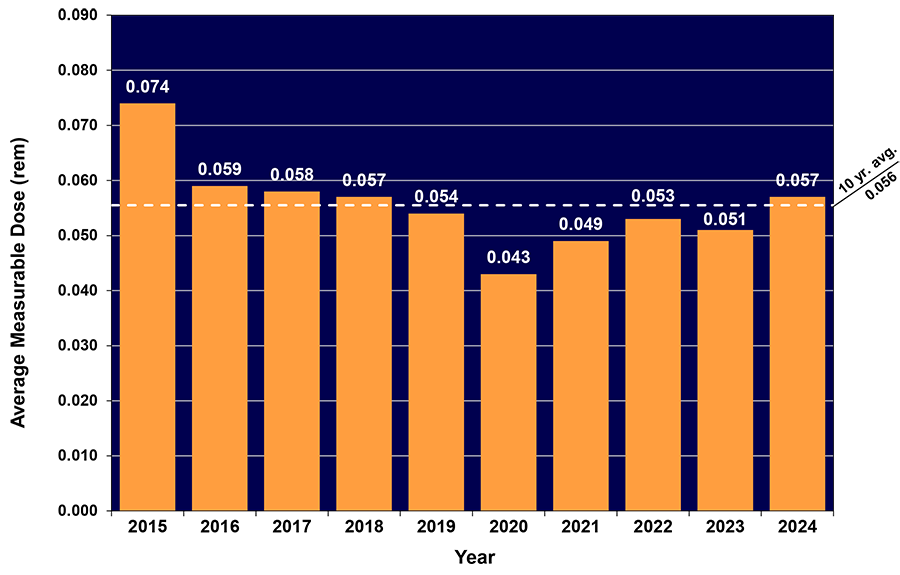
Average measurable TED has fluctuated in the past 10 years in accordance with increases and decreases in collective TED, especially as radiological activities have changed over the last decade.
Average measurable TED is calculated by dividing the collective TED by the number of individuals with a measurable TED. It is considered to be a good measure of the dose accrued by workers at DOE. However, it should be noted that it does not paint an exact picture of dose distribution across the worker population. Overall, average measurable TED from CY 2015 to 2018 was above the 10-year average of 0.056 rem while CY 2019 to 2023 has been below the 10-year average. The highest average measurable TED was in CY 2015 which correlates with an overall increase in radioactive work at four of the five largest sites (i.e., increases at Idaho Site, Hanford, LANL, and SRS). The average measurable TED has been decreasing since CY 2016, but there was a slight uptick in CY 2021 and CY 2022 as activities resumed after the COVID pandemic. TED also increased again in CY2024, despite a decrease in both the number of people and dose, the ratio between the two increased.
The average measurable TED has decreased overall by 23 percent from CY 2015 to 2024.
2015
Site with Minimum Average Measurable Dose Kansas City Plant 0.002 Site with Maximum Average Measurable Dose SPRU 0.465 2016
Site with Minimum Average Measurable Dose Kansas City National Security Campus 0.003 Site with Maximum Average Measurable Dose SPRU 0.471 2017
Site with Minimum Average Measurable Dose Kansas City National Security Campus 0.004 Site with Maximum Average Measurable Dose West Valley Demonstration Project 0.219 2018
Site with Minimum Average Measurable Dose National Renewable Energy Laboratory and
Princeton Plasma Physics Laboratory (tie)0.006 Site with Maximum Average Measurable Dose West Valley Demonstration Project 0.222 2019
Site with Minimum Average Measurable Dose National Renewable Energy Laboratory 0.001 Site with Maximum Average Measurable Dose West Valley Demonstration Project 0.147 2020
Site with Minimum Average Measurable Dose Kansas City National Security Campus 0.004 Site with Maximum Average Measurable Dose Uranium Mill Tailings Remedial Action 0.126 2021
Site with Minimum Average Measurable Dose Princeton Plasma Physics Laboratory 0.005 Site with Maximum Average Measurable Dose Uranium Mill Tailings Remedial Action 0.121 2022
Site with Minimum Average Measurable Dose SLAC National Accelerator Laboratory 0.000 Site with Maximum Average Measurable Dose West Valley Demonstration Project 0.109 2023
Site with Minimum Average Measurable Dose National Renewable Energy Laboratory and Office of Secure Transportation 0.000 Site with Maximum Average Measurable Dose Uranium Mill Tailings Remedial Action Project 0.052 2024
Site with Minimum Average Measurable Dose National Renewable Energy Laboratory and Grand Junction Site 0.001 Site with Maximum Average Measurable Dose Los Alamos National Laboratory and Office of Secure Transportation 0.098 -
Doses In Excess of Limits
Note: roll the cursor over the icons for additional information regarding the exceedances.
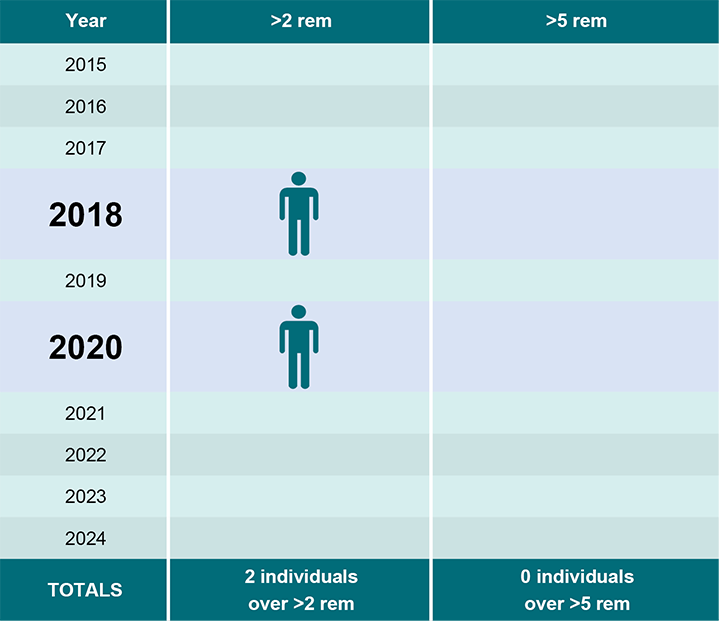
There were two administrative control limit exceedances over the 10-year period. Both exceedances were the result of puncture wounds.
Two specific TED limits are considered as a measure of high individual doses. The RadCon Manual [Ref. 1] established a maximum 2 rem Administrative Control Levels, and 10 CFR 835 establishes a regulatory TED limit of 5 rem per year. There have been zero doses in excess of the TED regulatory limit (5 rem [50 mSv]) in the period CY 2014 to 2023. In CY 2018, one individual was reported to have exceeded the 10 CFR 835.202 Total Organ Dose (TOD) limit of 50 rem; this individual also exceeded the 2 rem Administrative Control Level, but not the regulatory TED limit. This incident occurred when a worker's glovebox glove was punctured by a frayed wire cable. Details of the incident are available in the occurrence report NA--LASO-LANL-TA55-2018. In June of 2020, skin contamination and positive nasal smears were detected on one employee after an airborne release at LANL’s Plutonium Processing and Handling Facility. The source of the contamination was determined to be a breach in a glovebox glove. The individual received a CED of 2.4 rem (24 mSv) from Plutonium-238, resulting in a TED of 3.0 rem (30 mSv) for the year. Details of the incident are available in the occurrence report NA--LASO-LANL-TA55-2020.
[1] DOE-STD-1098-2017, "DOE Radiological Control Manual," U.S. Department of Energy, January 2017
Note: scroll over the icon for additional information regarding the exceedance.
Year Total Effective Dose (TED) (External + Internal Dose) (rem) Effective Dose (ED) from External Sources (rem) Committed Effective Dose (CED) from Intakes (rem) Committed Equivalent Dose (CEqD) from Intakes (rem) Intake Nuclides Facility Types Site 2018 3.808 0.208 3.600 118.5 Pu-238 TA-55 Facility LANL An event occurred in August 2018 at LANL that led to an exposure in excess of DOE annual limits.
In CY 2018, one individual was reported to have exceeded the 10 CFR 835.202 Total Organ Dose (TOD) limit of 50 rem. A plutonium-238 intake occurred in August 2018 at the Technical Area (TA) Plutonium Facility located at LANL. The intake occurred when a worker's glovebox glove was punctured by a frayed wire cable. Final bioassay results reported a total organ CDE of 118.5 rem and a CED of 3.6 rem. More details of the incident can be found in the occurrence report NA‑-LASO-LANL-TA55-2018-0013.
Year Total Effective Dose (TED) (External + Internal Dose) (rem) Effective Dose (ED) from External Sources (rem) Committed Effective Dose (CED) from Intakes (rem) Committed Equivalent Dose (CEqD) from Intakes (rem) Intake Nuclides Facility Types Site 2020 3.021 0.613 2.408 47.905 Pu-238 TA-55 Facility LANL An event occurred in June 2020 at LANL that led to an exposure in excess of DOE annual limits.
In CY 2020, one individual was reported to have exceeded the 10 CFR 835.202 Total Organ Dose (TOD) limit of 50 rem. A plutonium-238 intake occurred in June 2018 at the Technical Area (TA) Plutonium Facility located at LANL. Skin contamination and positive nasal smears were detected on one employee after an airborne release at LANL’s TA-55 Facility. The source of the contamination was determined to be a breach in a glovebox glove. The individual received a CED of 2.4 rem (24 mSv) from Plutonium-238, resulting in a TED of 3.0 rem (30 mSv) for the year. Details of the incident are available in the occurrence report NA‑-LASO-LANL-TA55-2020.
Changes in Regulations/Policy
Over the past 10 years (CY 2015 – 2024), there have only been minor changes in reporting requirements and radiation dose limits. The current DOE dose limits were implemented in CY 1989. It is worth noting, however, that the regulation regarding radiation protection standards and program requirements (10 CFR 835) has been amended four times (CY 1998, 2007, 2011, and 2017). Recent requirements of 10 CFR 835 include the adoption of ICRP 60 neutron weighting factors and the revision of ICRP dose conversion factors. Some sites noted that these new recommendations caused a reported increase in neutron dose, but the extent of the increase is not possible to determine from the data in REMS.
DOE Order (O) 231.1A, which outlined the annual reporting requirements for REMS, was issued in CY 2003 and replaced with DOE O 231.1B in CY 2011. DOE Manual (M) 231.1-1A, Environment, Safety, and Health Reporting Manual, was approved in CY 2004 but has since been replaced by the online REMS Reporting Guide in CY 2012.
DOE Order (O) 5480.11, Radiation Protection for Occupational Workers (CY 1988), and 10 CFR 835 require that each DOE facility have an ALARA (as low as reasonably achievable) program as part of its overall radiation protection program. According to the ALARA principle, resources spent to reduce dose need to be balanced against the risks avoided. This has been one of the fundamental pillars in radiation protection for DOE since the 1970’s. While some sites have reported that the use of ALARA has helped to reduce dose, it is not possible to measure the overall impact from ALARA improvement efforts as there are many other confounding factors such as the closure of facilities, reductions in production, and D&D efforts.
Laws and Requirements Pertaining to the Collection and Reporting of Radiation Exposures
| Title | Date | Description |
|---|---|---|
| 10 CFR 835, Occupational Radiation Protection |
Issued 12/14/93 |
Establishes radiation protection standards, exposure limits, and program requirements for protecting individuals from ionizing radiation that results from the conduct of DOE activities. |
| DOE Order 231.1B, Environment, Safety and Health Reporting |
Approved 6/27/11 |
Requires the annual reporting of occupational radiation exposure records to the DOE REMS repository. |
| REMS Reporting Guide | Issued 2/23/12 | Specifies the current format and content of the reports required by DOE Order 231.1B. |
DOE Dose Limits from 10 CFR 835
| Personnel Category | Section of 10 CFR 835 | Type of Exposure | Acronym | Annual Limit |
|---|---|---|---|---|
| General employees | 835.202 | Total effective dose. The sum of the effective dose (for external exposures) and the committed effective dose | TED | 5 rem (50 mSv) |
| The sum of the equivalent dose to the whole body for external exposures and the committed equivalent dose to any organ or tissue other than the skin or the lens of the eye | EqD-WB + CEqD (TOD) | 50 rem (500 mSv) | ||
| Equivalent dose to the lens of the eye | EqD-Eye | 15 rem (150 mSv) | ||
| The sum of the equivalent dose to the skin or to any extremity for external exposures and the committed equivalent dose to the skin or to any extremity | EqD-SkWB + CEqD-SK and EqD to the maximally exposed extremity + CEqD-SK |
50 rem (500 mSv) | ||
| Declared pregnant workers* | 835.206 | The equivalent dose to the embryo/fetus from the period of conception to birth as a result of occupational exposure of a declared pregnant worker. | EqD-Fetus | 0.500 rem (5 mSv) from the period of conception to birth |
| Minors | 835.207 | Total effective dose | TED | 0.100 rem (1 mSv) |
| Members of the public in a controlled area | 835.208 | Total effective dose | TED | 0.100 rem (1 mSv) |
* Limit applies to the embryo/fetus.
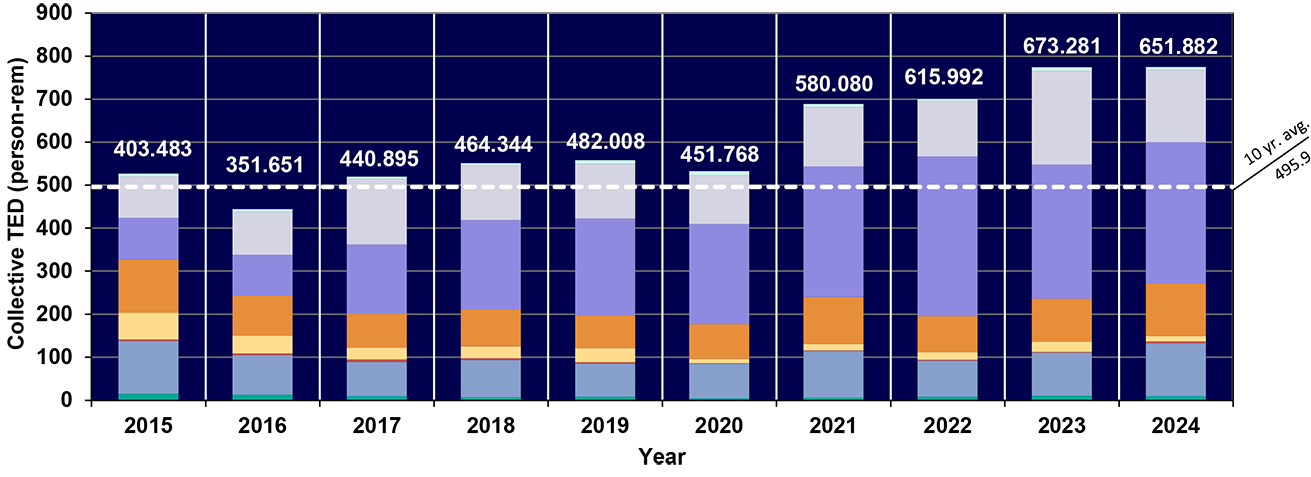
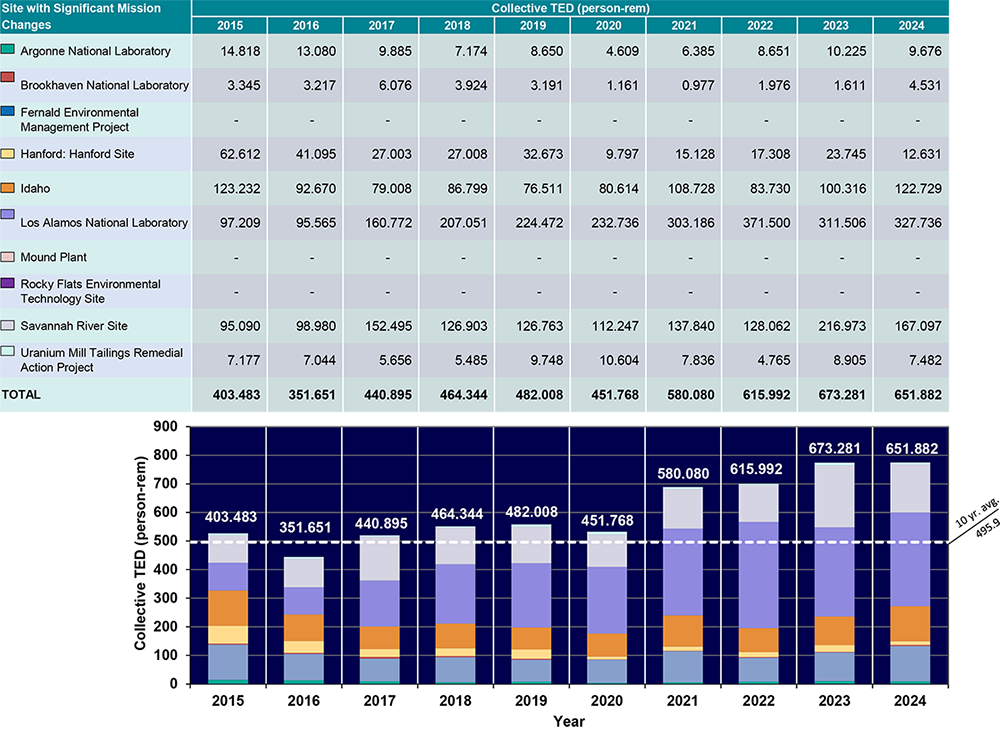
Changes in Mission
The Department of Energy (DOE) was officially created in CY 1977 with the Department of Energy Organization Act. The mission of the Department was focused on two major areas: defense activities related to nuclear weapons production and testing, and the consolidation of energy-related programs. The mission of DOE began to change significantly in the late 1980’s as the focus became less oriented around weapons production. Several facilities that historically had produced weapons and related components were no longer in operation by the end of CY 2014.
-
ARRA Funded Sites 2006 – 2015
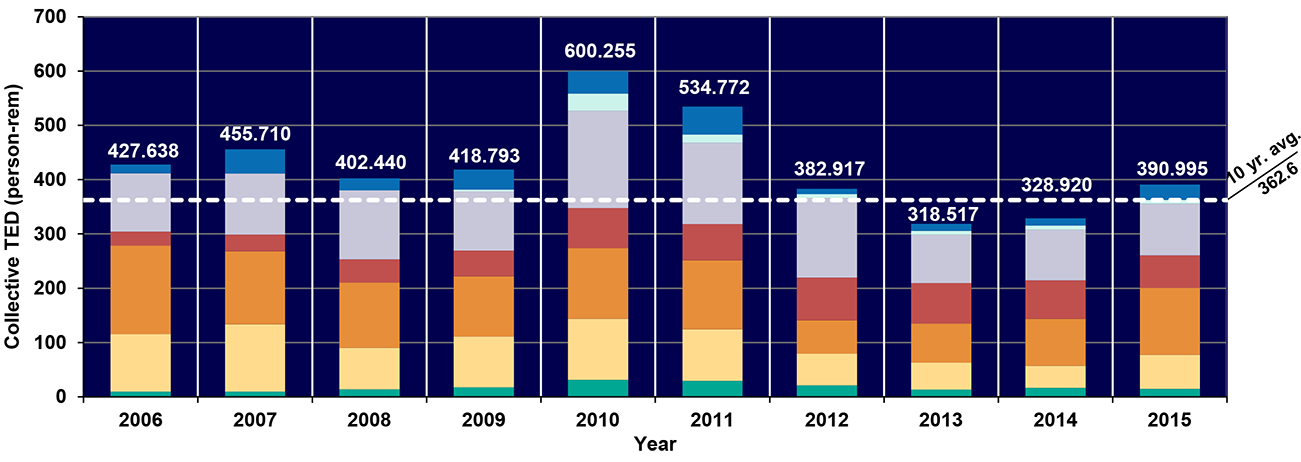
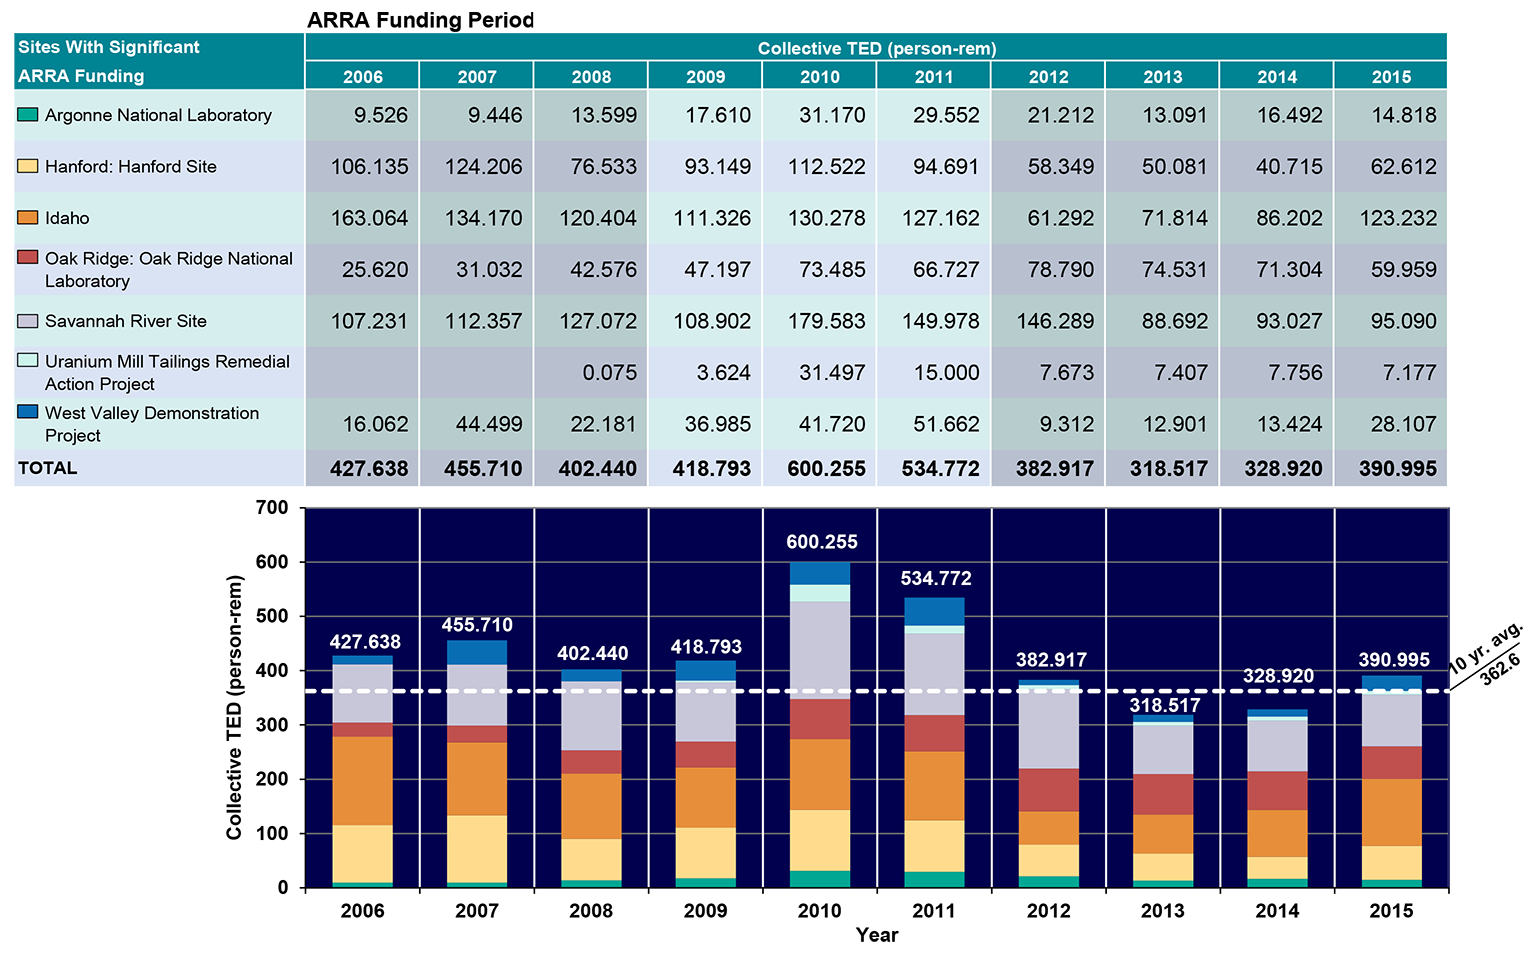
Note: roll the cursor over the highlighted section below for ARRA activity within the sites. From CY 2006 to 2008, collective dose was steadily decreasing across the DOE complex largely due to diminishing production and remediation activities; however, in CY 2009, the American Recovery and Reinvestment Act (ARRA) was passed, and almost $38.3 billion was allotted to DOE for FY 2009 and FY 2010. Over $5 billion was used to support remediation efforts at several sites and created almost 8,000 jobs. The largest portion of funding went to Hanford, Idaho, Savannah River, and Oak Ridge. An increase in activities and personnel led directly to a 10-year high of 600 person-rem in 2010 (66 percent higher than the 10-year average of 363 person-rem). As ARRA funding decreased, so did projects, resulting in a decrease in dose post-ARRA funding.
Increased waste removal activities
Accelerated cleanup and remediation activities; Increased D&D at PFP; Removal and processing of TRU waste
Increased D&D activities; Increased TRU waste operations; Remediation of buried waste
Increase in TRU waste and disposal activities; Increased D&D activities
D&D at Areas D, M, P, and R; Increased soil and groundwater remediation activities; Increase in TRU waste operations
Increased daily shipments; One-third of dose directly attributable to workers funded under ARRA
Sustained D&D activities then 50 percent decrease by 2012
-
Startup/Shutdowns
DOE has been in the process of remediating many sites, and several major ones were closed in the recent past including Fernald (CY 2004). Additionally, the gaseous diffusion plants at Portsmouth were placed in cold shutdown status in CY 2005. Cleanup was officially declared complete at Rocky Flats (CY 2005), and remediation began at Moab, UT (UMTRA) in CY 2008 (Approximately 15 million tons, or 93.5 percent, of tailings have been removed as of September 2024). Some decisions made in CY 2002 set the tone for the ten-year period of this report. DOE, EPA, and the State of Washington agreed to accelerate the cleanup at Hanford. In addition, operations at Idaho were transferred from the Office of Environmental Management to the Office of Nuclear Energy, although remediation still remained a priority. Environmental remediation continues at other large sites including Savannah River and Oak Ridge.
-
Maintained Operations
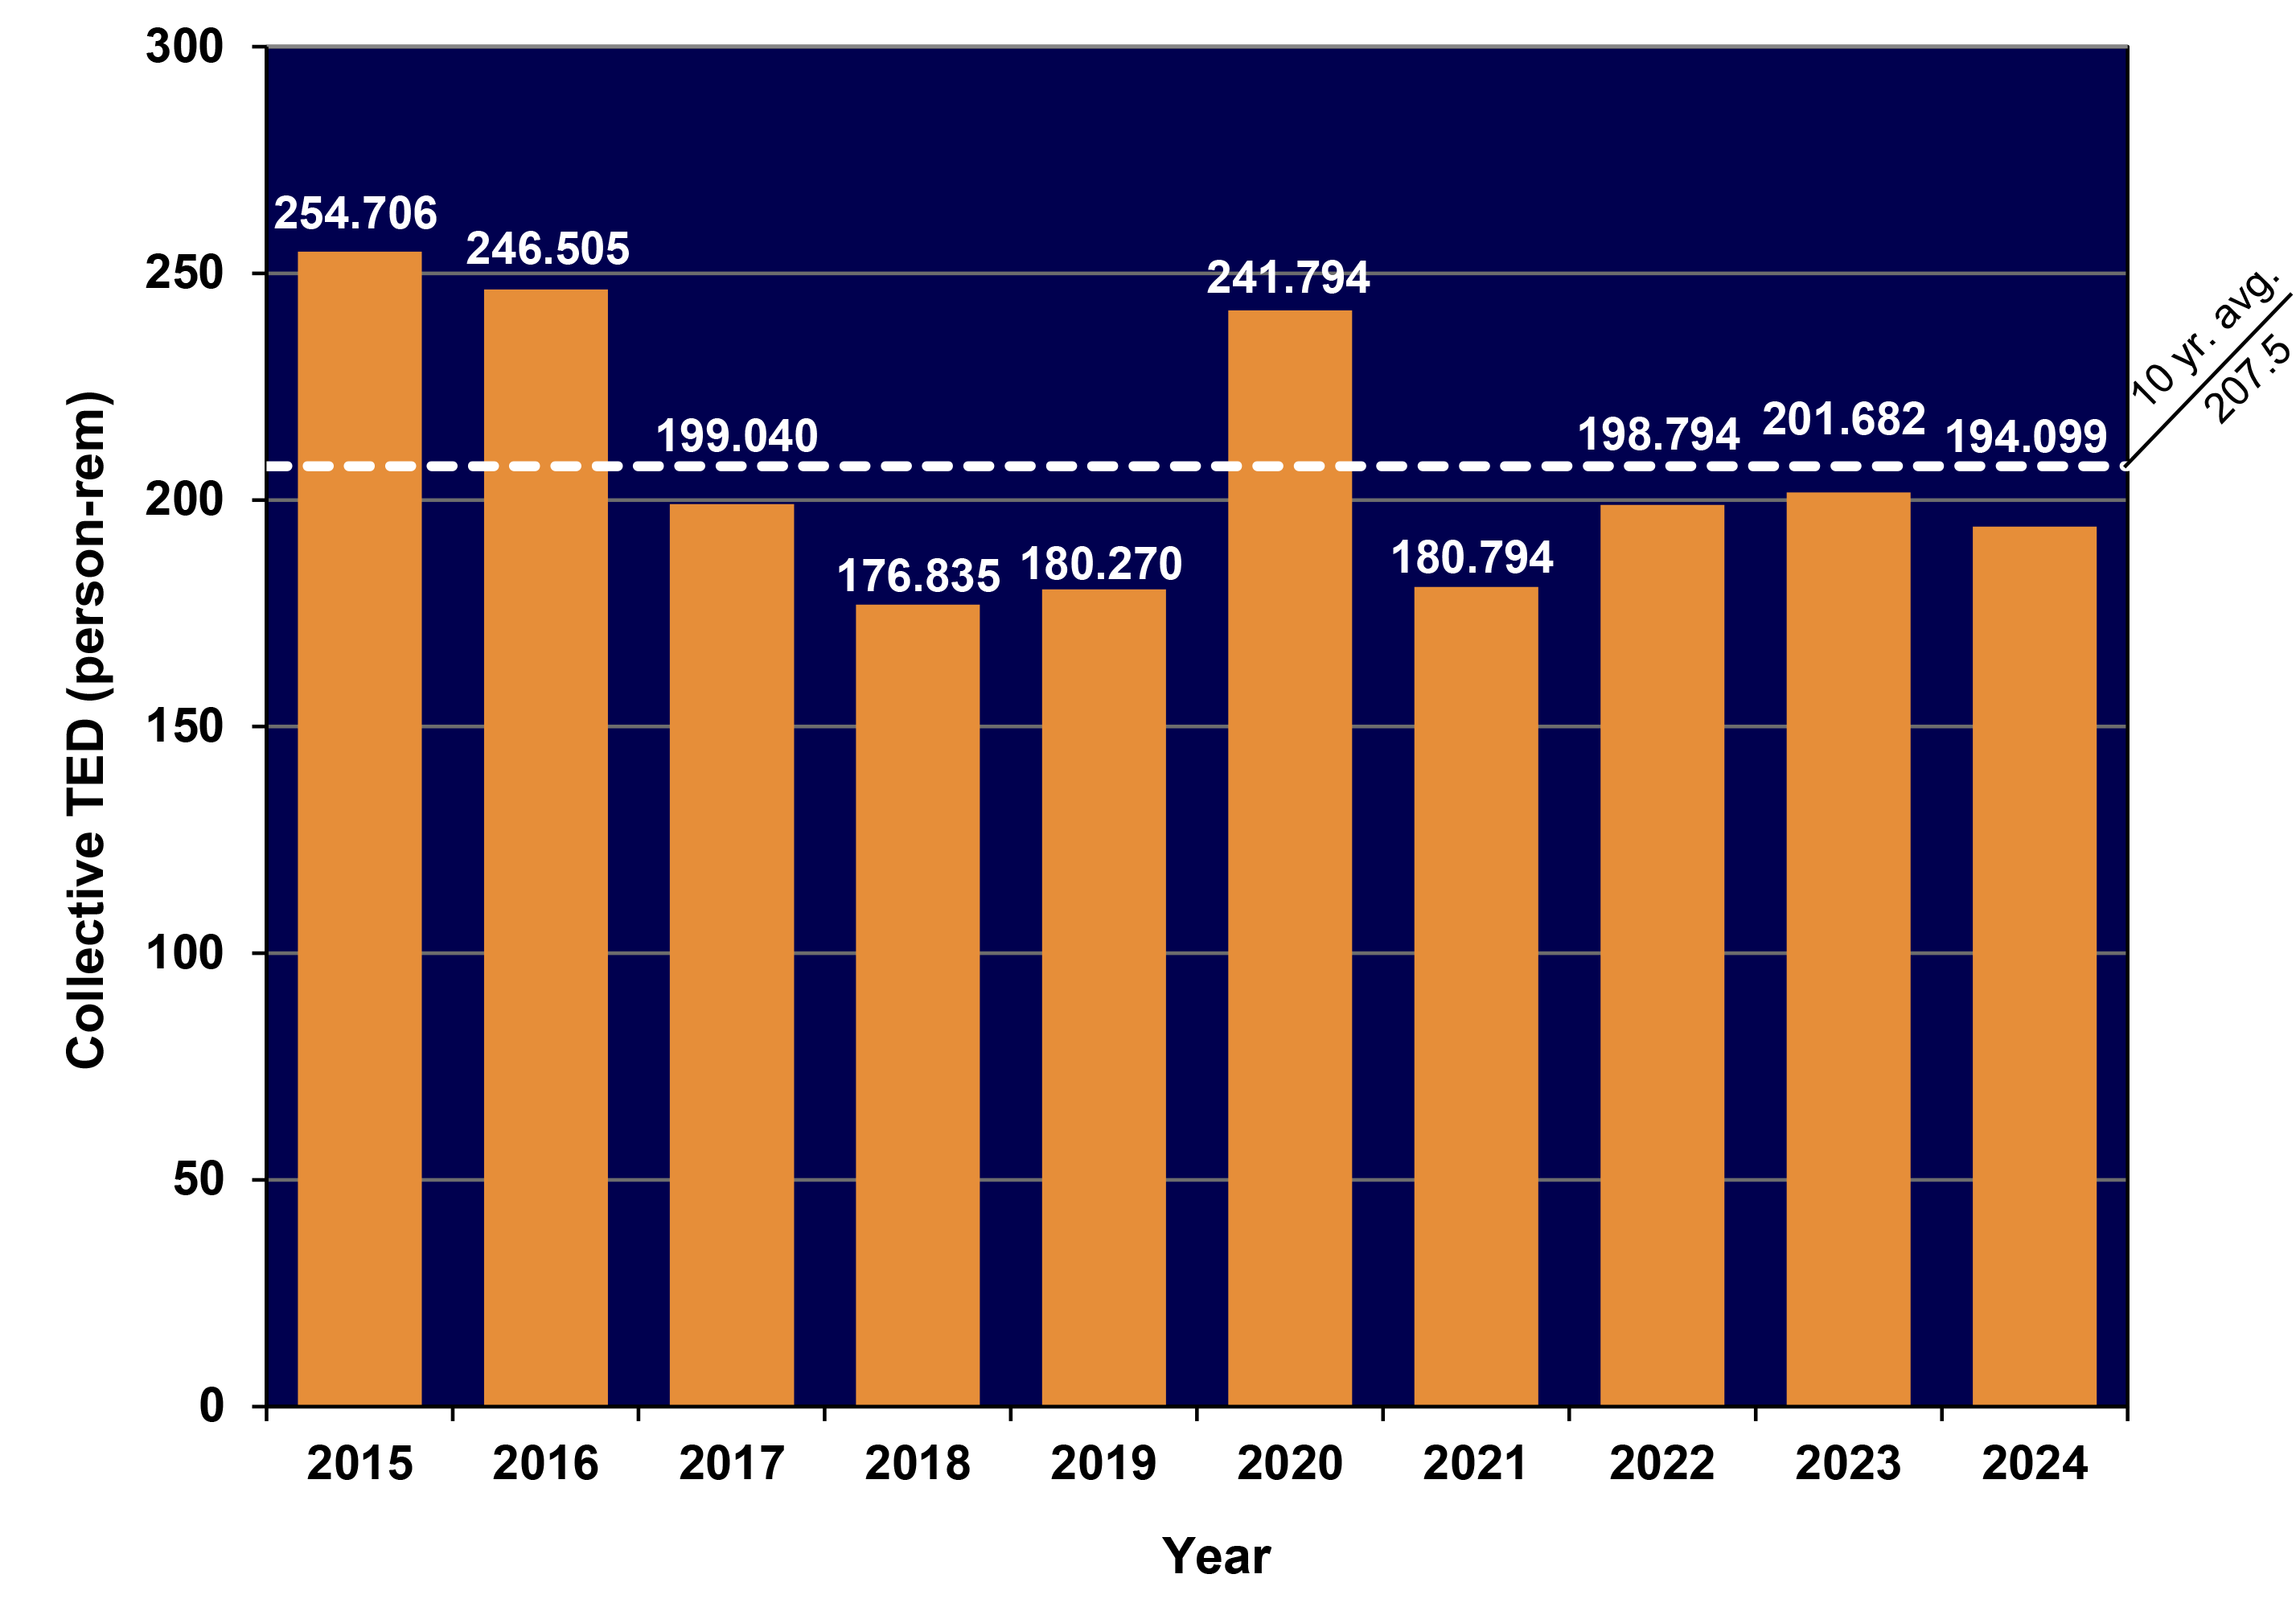
In addition to cleanup activities, DOE has also allocated more funds to non-nuclear research, including nanotechnology, renewable energy, and advanced materials. This shift in research priority has continued to lessen the radiation exposure that workers receive. ALARA continues to be a pillar of radiation worker protection in DOE, but the combination of safer work practices along with diminished weapons production, site closures, and shrinking environmental footprints for remediation have all contributed to an overall downward trend in dose for the past 10 years.Collective TED has been fluctuating for this group of sites. Collective TED in CY 2016 decreased by 8 percent as SPRU finished the removal of the more significant source term activity. There was a 45 percent increase in collective TED from CY 2019 to 2020. This increase was primarily due to an increase in dose at Pantex Plant. Collective TED decreased to 199 person-rem in CY 2022, in line with previous years. In CY 2023, collective TED increased 4 percent to 202 person-rem. In CY 2024, collective TED decreased 4 percent to 194 person-rem.
Collective TED (person-rem) Sites Not Included in ARRA or Mission Changes 2015 2016 2017 2018 2019 2020 2021 2022 2023 2024 Ames Laboratory 1.247 1.240 1.053 0.935 0.837 0.777 0.710 0.565 0.778 0.704 Energy Technology Engineering Center 0.068 0.089 0.026 0.059 0.009 0.045 Fermi National Accelerator Laboratory 16.640 11.930 10.210 9.980 7.060 7.850 6.110 8.780 3.360 3.040 Grand Junction Site 0.010 0.336 0.041 0.043 0.158 0.013 0.003 0.004 Hanford: Office of River Protection 38.608 37.102 24.387 24.926 24.153 13.291 27.476 22.637 20.427 14.672 Hanford: Pacific Northwest National Laboratory 12.581 11.599 13.555 12.225 9.717 8.523 17.127 33.264 18.488 15.598 Kansas City National Security Campus 0.020 0.063 0.171 0.428 0.364 0.493 0.920 0.110 0.312 0.845 Lawrence Berkeley National Laboratory 0.796 0.823 1.257 1.014 1.810 0.834 0.582 0.497 0.434 1.020 Lawrence Livermore National Laboratory 8.274 8.005 6.947 8.691 11.670 9.834 17.680 22.621 27.907 24.999 National Renewable Energy Laboratory 0.028 0.034 0.020 0.006 0.001 0.030 0.000 0.005 0.003 0.001 Nevada National Security Site 5.045 3.295 3.858 3.893 1.940 1.800 1.821 2.876 2.351 4.081 New Brunswick Laboratory 0.000 0.096 Oak Ridge: East Tennessee Technology Park 0.059 0.114 0.093 0.147 0.186 0.751 0.468 0.701 0.577 0.829 Oak Ridge: Oak Ridge Institute for Science and Education 0.122 0.171 0.243 0.317 0.237 0.025 0.129 0.098 0.063 Oak Ridge: Y-12 National Security Complex 58.010 72.752 75.761 65.917 61.751 59.591 54.186 57.144 50.006 52.164 Office of Secure Transportation 0.029 0.072 0.311 0.288 0.448 0.025 0.084 0.157 0.048 0.786 Paducah Gaseous Diffusion Plant 7.058 6.201 5.159 4.593 5.554 2.654 2.465 2.983 4.172 5.088 Pantex Plant 22.618 25.918 24.986 22.927 24.248 113.909 23.755 25.909 40.176 34.205 Portsmouth Gaseous Diffusion Plant 4.716 2.509 2.553 3.588 4.289 1.107 2.029 4.259 5.993 5.667 Princeton Plasma Physics Laboratory 0.623 0.311 0.361 0.239 0.391 0.234 0.222 0.255 0.336 0.280 RMI Site 0.000 0.000 0.000 0.000 0.000 0.000 Sandia National Laboratories 5.284 2.756 2.146 5.819 5.323 3.287 3.092 6.477 7.959 9.181 Savannah River National Laboratory 12.358 20.051 8.668 16.631 11.717 14.896 7.665 15.793 11.665 Separations Process Research Unit 69.291 47.541 5.185 0.208 0.029 0.012 0.016 0.013 0.011 Service Center Personnel* 0.011 0.268 0.091 0.149 0.996 3.116 3.719 0.428 1.637 7.432 SLAC National Accelerator Laboratory 0.069 0.170 0.057 0.047 0.206 0.146 0.036 0.045 Thomas Jefferson National Accelerator Facility 3.348 0.777 0.270 0.526 1.266 0.607 1.974 0.854 0.612 0.451 Waste Isolation Pilot Plant 0.161 0.311 0.279 0.909 1.113 1.130 1.283 0.449 0.163 0.268 Total 254.706 246.505 199.040 176.835 180.270 241.794 180.794 198.794 201.682 194.099 * Includes personnel at NNSA Albuquerque complex and Oak Ridge in addition to several smaller facilities not associated with a DOE site.
Top Contributors
The five sites shown contribute the majority of the collective radiation dose at DOE. The examination of these sites and the changes in dose experienced at these sites is instructive due to the contribution of these sites to the overall DOE collective dose.
-
Idaho
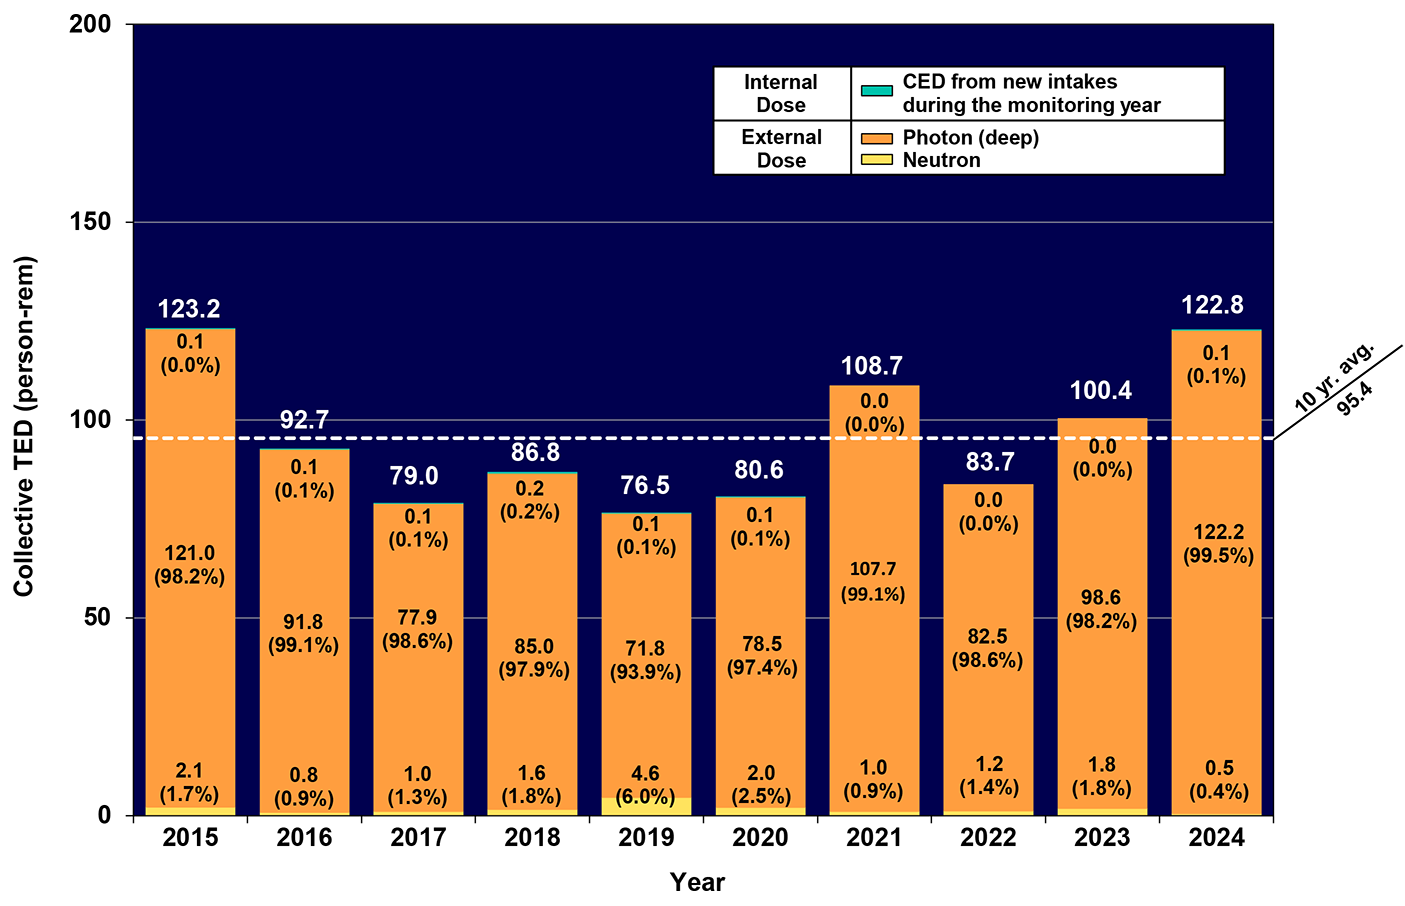
The DOE Idaho Site, located at Idaho Falls, Idaho, consists of four facilities: Idaho National Laboratory (INL), the Advanced Mixed Waste Treatment Project (AMWTP), the Idaho Cleanup Project (ICP), and the DOE Idaho Operations Office. From CY 2015 to 2024, over 68,000 annual monitoring records were submitted. Total collective dose was generally low from CY 2016 to 2020. The 10-year average collective dose was 95.4 person-rem. The composition of dose at Idaho Site is consistent with most DOE sites, in that the greatest component of dose is deep dose.
In 2015, dose was higher than average due to increased Department of Homeland Security training exercises and accelerated waste processing operations to meet contractual obligations. Collective dose in CY 2017 decreased by 15 percent from CY 2016 as the result of decreased decontamination activities, along with decreased level of radioactivity of the waste that was handled. In CY 2018, collective dose increased by 10 percent from CY 2017 as upgrade and maintenance activities were conducted. In CY 2019, overall collective dose decreased 12 percent to 76.5 rem, but the neutron dose component increased 188 percent from 1.6 rem in CY 2018 to 4.6 rem in CY 2019. In CY 2021, dose increased 35 percent from CY 2020 due to waste management activities in areas associated with higher radiation exposure levels along with preventive and corrective maintenance work at the Advanced Test Reactor Complex (ATR). In CY 2022, overall dose decreased 23 percent to 83.7 person-rem, below the 10-year average of 95.4 rem. In CY 2023, collective TED increased to 100.2 person-rem, a 20 percent increase from 2022. The increase in dose can be attributed to activities performed to meet a significant milestone for the ATR and the completion of several significant waste management tasks in high dose rate areas. In CY 2024, the collective TED increased 22 percent to 122.8 person-rem due to work in high dose rate areas and the processing of a significant amount of radioactive waste.
-
Los Alamos National Laboratory
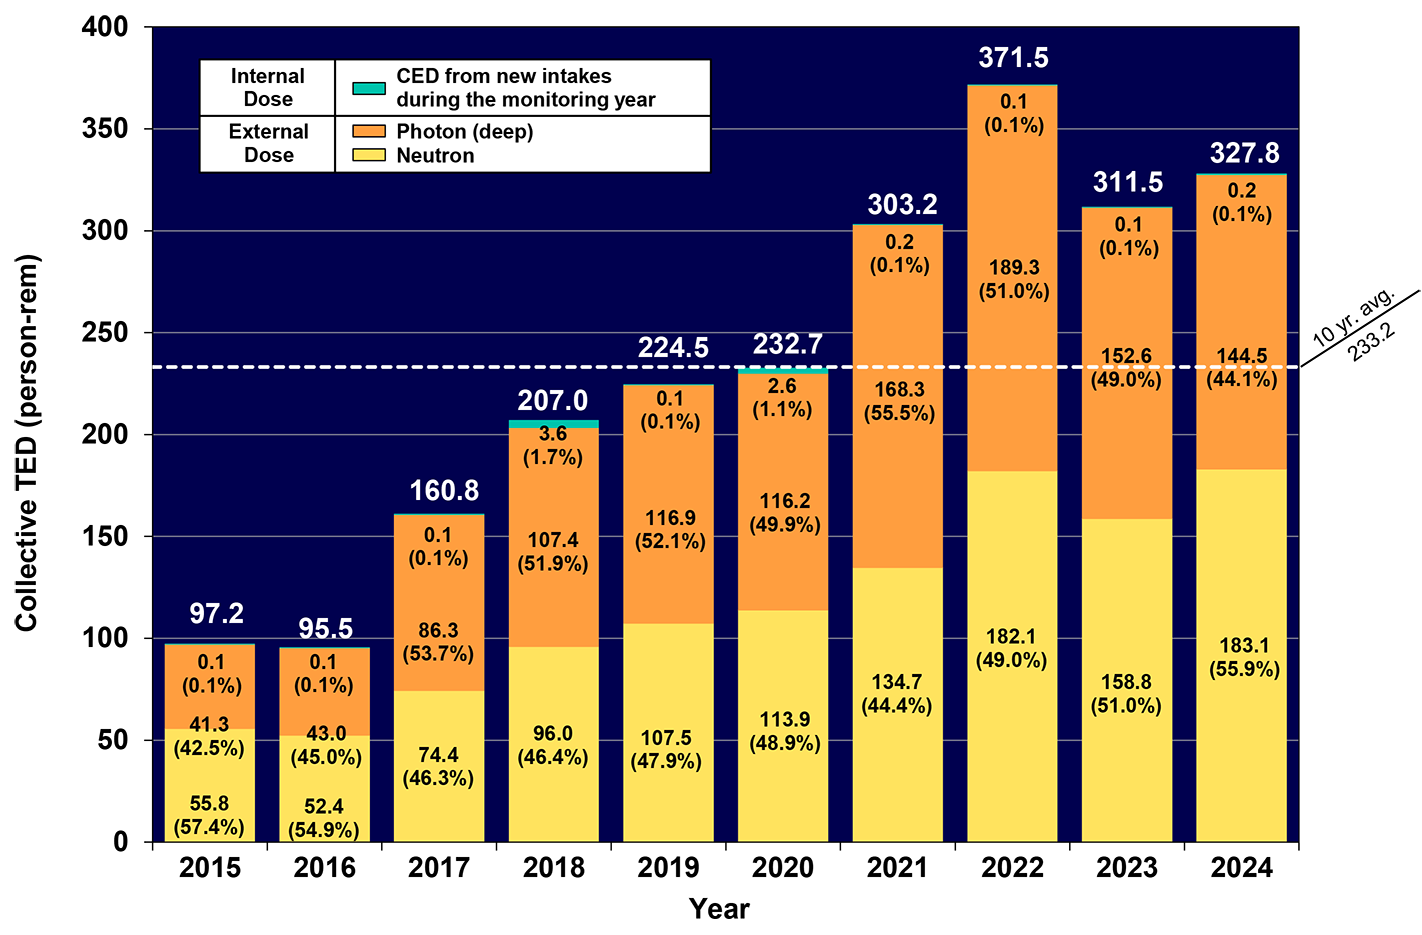
Los Alamos National Laboratory (LANL) is located 35 miles northwest of Santa Fe, New Mexico, includes more than 2,000 individual facilities and currently employs over 10,000 individuals. From CY 2015 to 2024, nearly 153,000 annual monitoring records were submitted. The total dose has been trending upwards since CY 2015, increasing 237 percent from 97.2 person-rem in CY 2015 to 327.8 person-rem in CY 2024. The composition of dose at LANL is unusual because the largest component is neutron dose, which accounted for 44.4 – 57.4 percent of total dose in the 10-year period. This is the only site out of the top five contributors that has this characteristic; this is explainable by the fact that LANL processes plutonium in gloveboxes, which can result in a neutron dose from the alpha/neutron reaction and from spontaneous fission of the plutonium.
Work with solid waste was curtailed early in CY 2014 due to the radioactive material release event at the Waste Isolation Pilot Plant and its relation to LANL waste packaging. (See Occurrence Report EM-CBFO-NWP-WIPP.) Starting in CY 2016, programmatic work resumed. This has resulted in increasing dose since the resumption of work. The majority of dose at LANL is attributable to increased operations at TA-55 (Plutonium Processing Facility). Within the 10-year period, the highest collective dose (371.5 person-rem) occurred in CY 2022. Several factors contributed to the uptick in dose in 2022, including increased work and number of personnel at the plutonium facility and an abnormal event while troubleshooting a vacuum leak at the neutron science center. Unlike the other sites in the Complex that had decreases in dose during the COVID-19 pandemic, LANL collective dose increased and has remained above the 10-year average of 233.2 person-rem since CY 2021.
-
Oak Ridge
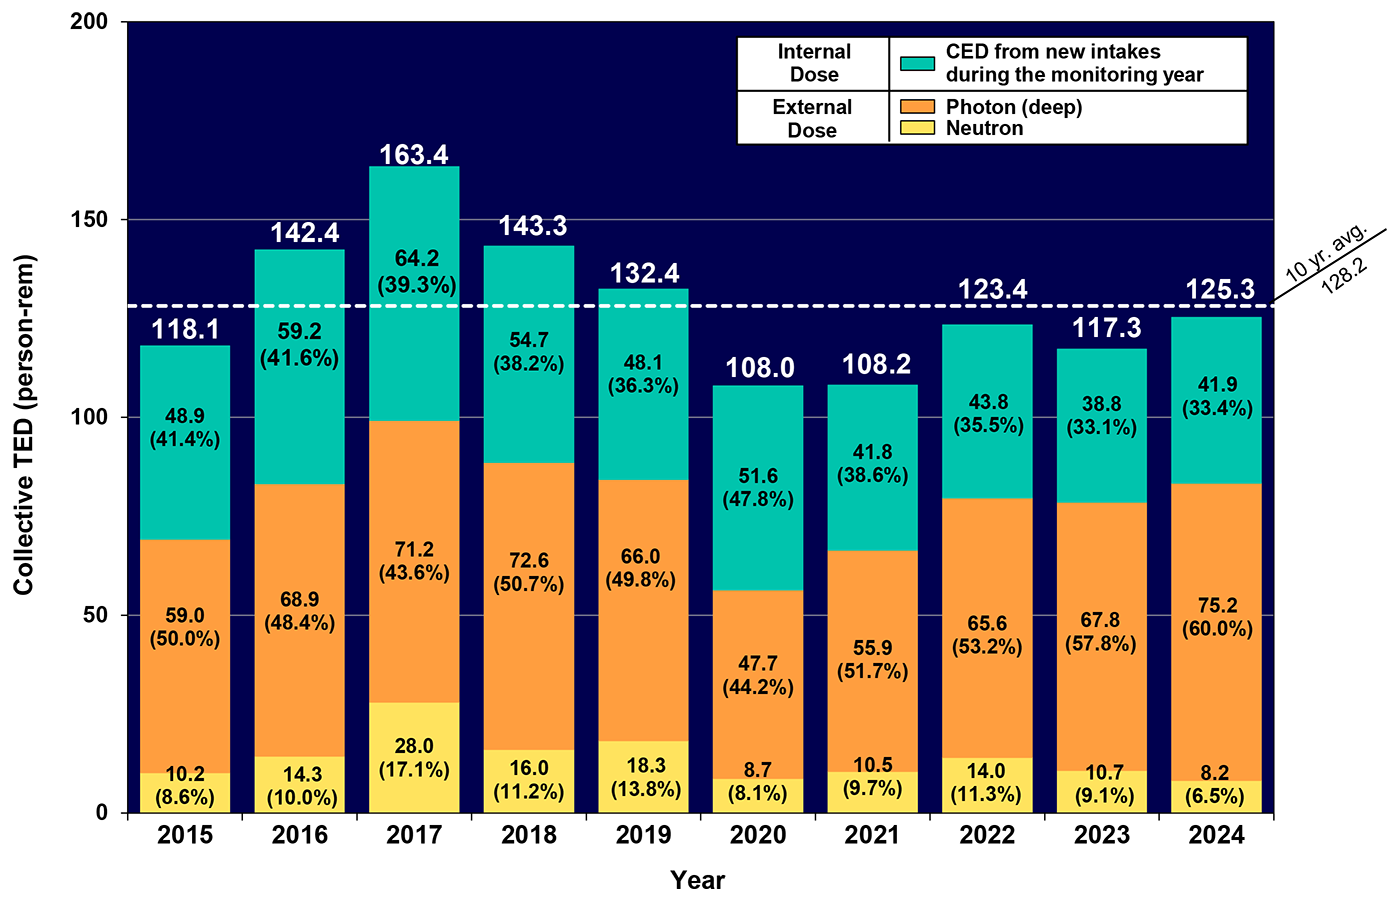
Oak Ridge includes operations from Y-12 National Security Complex (Y-12), Oak Ridge National Laboratory (ORNL), the Oak Ridge Institute for Science and Education (ORISE), and the East Tennessee Technology Park (ETTP), formerly known as the K-25 Site. Over 117,000 annual monitoring records were received from Oak Ridge during the last 10 years (CY 2015– 2024). Collective dose at Oak Ridge fluctuated around the 10-year average (128.2 person-rem), but from CY 2016 - 2019, the collective dose has been above average, primarily due to maintenance and waste handling activities at neutron research and radiochemistry facilities, and increased project work activities at hot cell and radiochemistry facilities. Collective dose has been below the 10-year average since CY 2020.
Overall, there is no clear trend over the past 10 years at Oak Ridge regarding total collective dose with the exception that isotope production at ORNL is the primary driver behind the total collective dose for Oak Ridge. Oak Ridge is unique in that the largest component of dose has consistently been internal dose (ranging from 33 – 48 percent). No other site in the top five contributors to dose has this characteristic as typically over 90 percent of all internal dose throughout the complex originates at Y-12 during uranium processing. Usually, one-third of all internal dose measurements taken are through air sampling.
A 10 percent decrease in CY 2015 was the result of intermittent work stoppages throughout the year at Y-12 from weather and other factors and a decrease in collective TED at the transuranic waste processing center. A 21 percent increase in CY 2016 was the result of increased activities at the radiochemistry facilities in addition to increased maintenance and waste handling activities. A 15 percent increase in CY 2017 was attributed to maintenance and waste handling activities at neutron research and radiochemistry facilities, and increased project work activities at hot cell and radiochemistry facilities. In CY 2018, collective dose decreased 12 percent from CY 2017 levels from decreased work activities at hot cell and radiochemistry facilities. CY 2019 collective dose decreased 8 percent from the previous year. Similar to other sites, there was a curtailment of radiological work in 2020 due to the COVID-19 pandemic which resulted in an 18 percent decrease in collective TED. Collective dose remained low in CY 2021 as work remained curtailed at the site. As work resumed in CY 2022, collective TED increased 14 percent from CY 2021 but remained below the 10-year average. The decrease in collective TED continued in CY 2023, decreasing by an additional 5 percent. In CY 2024, collective TED increased 8 percent to 125.3 person-rem, while remaining below the 10-year average.
-
Hanford
Hanford, located near Richland, Washington, consists of the Hanford Site, the Office of River Protection (ORP), and the Pacific Northwest National Laboratories (PNNL). From CY 2015 to 2024, over 94,000 annual monitoring records were submitted. While collective dose fluctuated over the ten-year period, the general trend was a 61 percent decrease in dose over the past 10 years.
Since CY 2015, neutron dose has continued to decrease. In CY 2024, neutron dose contributed 2 percent of the collective TED, in comparison to CY 2015 when neutron dose comprised 5 percent of the collective TED. Increases in CY 2015 were primarily related to work at the plutonium finishing plant facility, including the dismantlement of two large glove boxes in the process lines and the cleanout of the plutonium recovery facility canyon. Decreases in CY 2017 were associated with a transition in work activities from source term removal to facility demolition at the Plutonium Finishing Plant (PFP) facility and the continued operation of several projects at minimal levels due to changes in funding. The collective dose fluctuated around 65 rem from CY 2017 through CY 2023, except for CY 2020 when there was a curtailment of radiological work due to the COVID-19 pandemic. This curtailment in work resulted in a 52 percent decrease in collective TED to a 10-year low of 32 rem. The collective dose in CY 2024 remained one of the lowest doses in in the 10-year period, at only 43.9 person-rem.
-
Savannah River
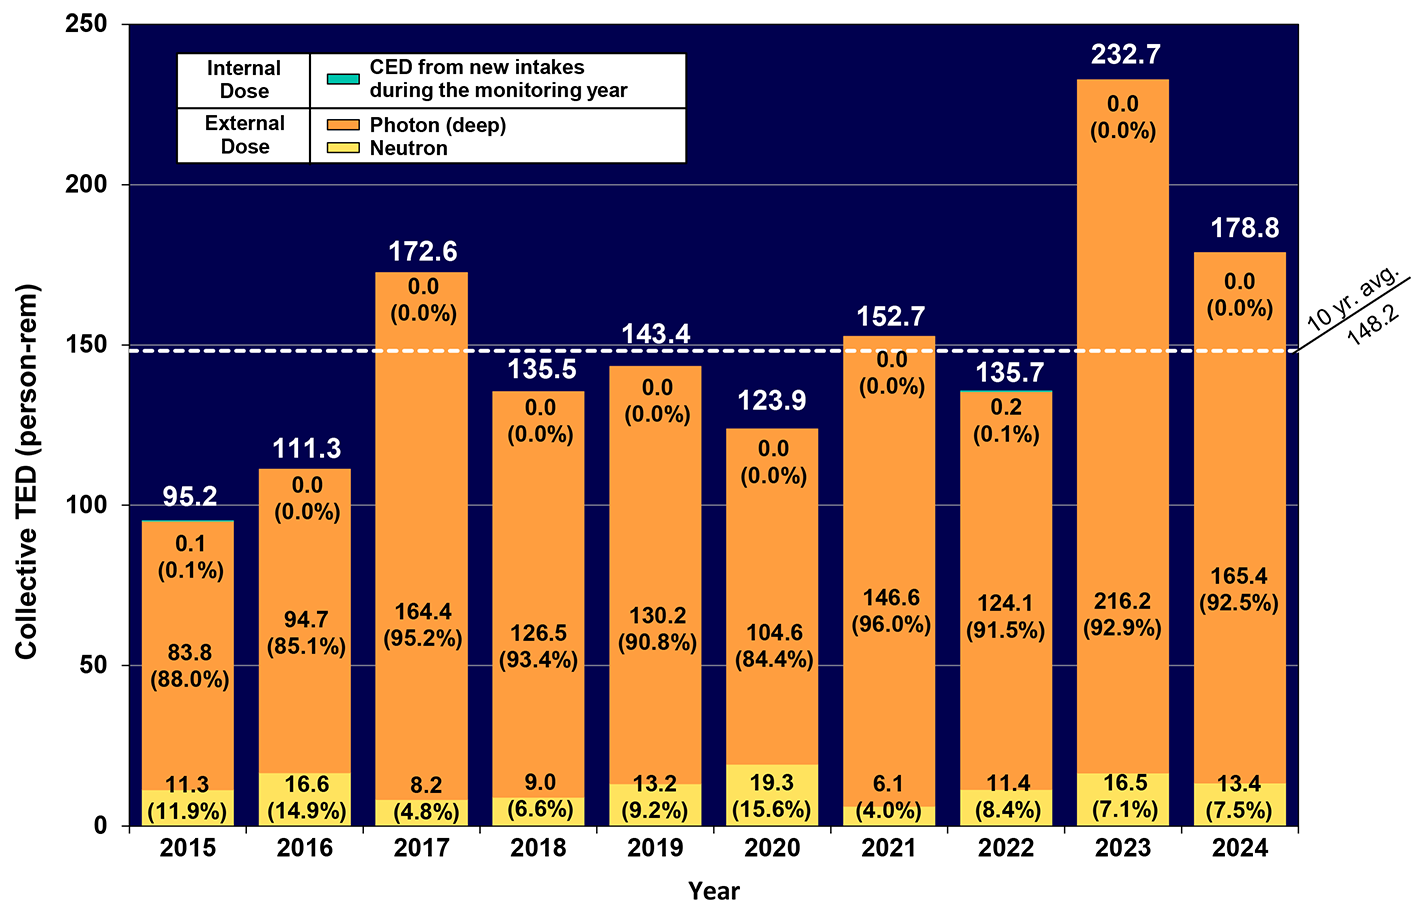
Savannah River (SR) is a 310 square mile DOE site located near Aiken, South Carolina. It includes multiple organizations, including DOE Savannah River Operations Office, the NNSA Savannah River Site Office, and the Savannah River National Laboratory (SRNL). Over 70,000 annual monitoring records were submitted from CY 2015 to 2024 at SR. Total collective dose remained below the 10-year average (148.2 person-rem) from CY 2014 to 2016. This reduction in dose is attributable to the implementation of a variety of tools and techniques to reduce dose and the reduction in ARRA-funded activities.
In CY 2014, a slight increase in collective dose from CY 2013 was attributed to completing projects like the SRNL Cell Window replacements. Increases in CY 2016 were attributed to the remediation of 1950s era storage tanks and resuming process operations in portion of the H Canyon. The 55 percent increase in collective dose from CY 2016 to 2017 can be attributed to more workers engaging in activities with a high potential for exposure such as the 3H evaporator pot repair and the Defense Waste Processing Facility Melter 2 removal and replacement. The collective dose increased by 6 percent from CY 2018 to 2019 but remained lower than CY 2017 levels. In CY 2020, TED decreased 14 percent from CY 2019 as work was slowed due to the COVID-19 pandemic. As work resumed in CY 2021, collective TED increased 23 percent from the previous year. Collective TED decreased 11 percent in CY 2022. In CY 2023, collective TED increased 71 percent as the site set a single-year record by processing nearly 3.2 million gallons of radioactive salt waste. In CY 2024, collective dose was 23 percent lower, at 178.8 person-rem.
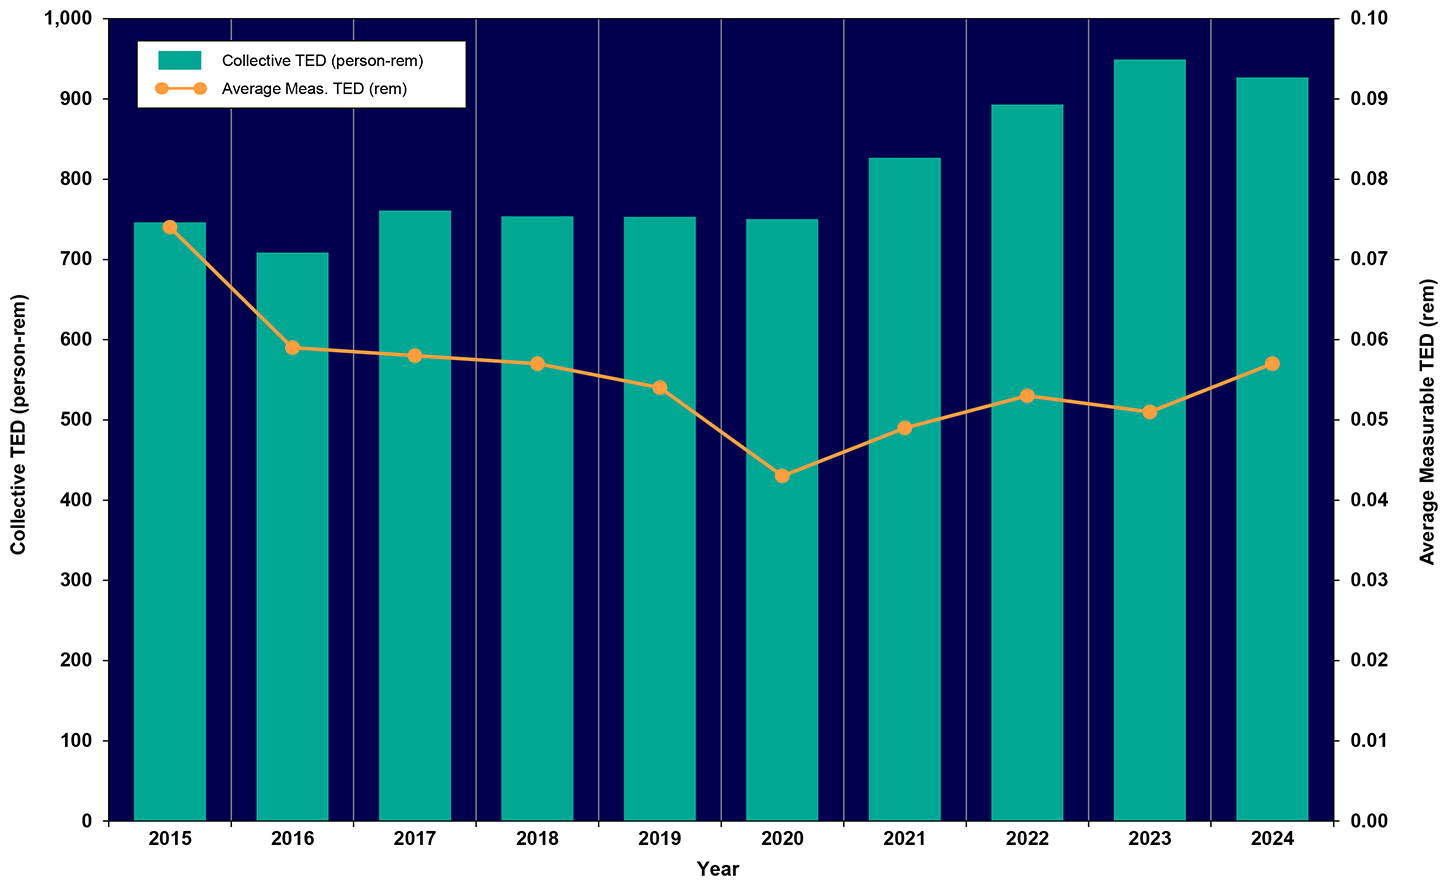
Historical Overview
Collective dose in the DOE Complex increased by 24 percent from CY 2015 to 2024. From 2017 through 2020, dose remained constant, fluctuating around 754 person-rem. As sites ramped back up from pandemic-era work curtailment, dose steadily increased from 826 per-rem in 2021 to 949 person-rem (a 10-year high) in 2023, and slightly decreasing by 2 percent in CY 2024 to 926.8 person-rem.
Beginning in CY 2009, dose increased as ARRA-related funding helped secure additional sources of funding for D&D activities at multiple DOE sites, primarily Hanford and Idaho, and for increased production work at Oak Ridge, LANL, and Pantex. In CY 2010, collective dose rose to its highest level since CY 2005 due to the additional work funded by ARRA. However, as ARRA-related funding began to diminish, so did work activities and dose, as collective TED decreased from CY 2010 to 2014. Since CY 2015, collective dose has remained steady, averaging around 744 person-rem from CY 2015 to 2020.
While DOE Order 231.1A (2003) and 231.1B (2011) were implemented regarding reporting, no significant changes were seen. The amendments to 10 CFR 835 appear to have had minimal impact on the collective dose as operational changes in mission were more significant. There does appear to be some dose reduction from CY 2011 to 2012 due to better ALARA awareness and use of safety technology, but this is confounded by a reduction in ARRA activities as well. In CY 2013, the overall decrease in collective TED was attributed to preparation for government shutdown during October sequestration and work reductions due to budget constraints. The slight collective TED decrease in CY 2014 was attributed to curtailing work with solid waste and changes in work scope to incorporate ALARA processes.
DOE Dose Limits from 10 CFR 835
Note: roll the cursor over the bar for each year to see changes with respect to the Sites, Policy, or Geopolitical.
2015
Sites
- At Idaho National Laboratory, exposure activities performed included work at the Advanced Test Reactor Complex, including experiment system operations, plant maintenance modifications, routine ATR power operations, routine ATR outage operations, and Research and Development Operations/Laboratory Support.
- At SPRU, increased cleanup activities at SPRU resulted in a 642 percent increase in collective TED from CY 2014 to 2015.
- In CY 2015, WVDP dose was attributed to demolition preparation work in the liquid waste cell, all three extraction cells, the off-gas cell/off gas blower room, sample storage cell, and the vitrification facility.
- WIPP continued decontamination efforts in the WIPP underground as well as resumption of limited activities.
- At Sandia National Laboratory, there was a decrease in the number of waste and material disposition campaigns at the auxiliary hot cell facility and experiments at the annular core research reactor.
- At PPPL, there was reduced access to the NSTX-U test cell during the first half of CY 2015.
2016
Sites
-
At Hanford, the collective dose decrease is associated with a change in work activities at the plutonium finishing plant facility. Due to changes in funding, several Hanford projects continue to operate at minimal levels.
-
ORNL had a 16 percent increase in dose from CY 2015 primarily due to increase work activities at the hot cell and radiochemistry facilities in addition to increased maintenance and waste handling activities.
-
WIPP resumed a limited number of activities, resulting in an 83 percent increase in dose.
-
In CY 2016, WVDP dose was attributed to demolition preparation work in the liquid waste cell, all three extraction cells, the off-gas cell/off-gas blower room, sample storage cell, and the vitrification facility.
-
SPRU had a 32 percent decrease in collective dose from CY 2015 as the result of the removal of the more significant source term activity.
2017
Sites
-
At SRS, the increase in collective dose from CY 2016 to 2017 can be attributed to more workers engaging in work with a high potential for exposure.
-
At LANL, programmatic work at TA-55 was fully resumed and the facility was operating at normal capacity following a shutdown in CY 2013; and solid waste handling work that was curtailed in early 2015, due to a contamination release event at the Waste Isolation Pilot Plant (WIPP), resumed.
-
At ORNL, dose increased in CY 2017 due to maintenance and waste handling activities at neutron research and radiochemistry facilities, and increased project work activities at hot cell and radiochemistry facilities.
-
At INL, waste handling activities and resin transfer operations decreased significantly in CY 2017, along with the level of radioactivity of the waste that was handled.
-
At Hanford Site, the decrease in collective dose at the Plutonium Finishing Plant (PFP) facility was associated with a transition in work activities from source term removal to facility demolition.
-
SPRU completed the work in the H2 building for maintenance, process equipment removal, concrete scabbling, and sump debris removal.
-
Paducah changed the administrative screening level from 5 mrem to 10 mrem based on a study of offsite background variation. This change simultaneously contributed to a decrease in the collective dose, and an increase in the average measurable dose since doses below 10 mrem are no longer included as measurable doses.
-
Grand Junction Site reported for the first time in CY 2017. All doses received were from routine field activities performed by Legacy Management personnel and were very low.
2018
Sites
- One individual received dose above the DOE ACL 2 rem limit at LANL.
- At Savannah River, the collective dose decreased by 22 percent from CY 2017 to 2018 as activities with a high potential for exposure were completed.
- At LANL, programmatic work at TA-55 was fully resumed and the facility was operating at increased capacity following a stand down in CY 2013.
- Beginning May 2018, solid waste handling at LANL’s TA-54 facility transitioned to a new contractor, under DOE-EM oversight.
- At ORNL, CY 2018 saw an increase in dose for project work at accelerator, radiochemistry, and some hot cell facilities, which was offset by a decrease in dose at the research reactor facility and other hot cell facilities.
- At INL, dose increased due to loop experiment sponsor upgrade activities associated with asbestos removal from loop piping in the 1D-N primary cubicle and emergent work to replace the 1D-N inpile tube involving high radiation work in the subpile room.
- For WVDP, the CY 2018 overall dose increased from the previous year due primarily to increased manned-entries in high dose rate areas in the Main Plant, to open air demolition activities of the Vitrification Facility and the inventorying and removal of high radiation boxes from CPC/outside storage areas into LSA-3.
- Doses at Hanford Site remained lower as there was a transition in work activities from removal to facility demolition.
- LLNL instituted a change in dosimetry issuance policy which resulted in a significant decrease in the monitored population.
- At Argonne National Laboratory, the decreases in collective TED and average measurable TED are attributed to decontamination work at the Alpha Gamma Hot Cell Facility taking less time than anticipated with lower dose rates than previously observed during the same type of work in CY 2014.
2019
Sites
- LANL dose increased as the result of the successful startup of radiological work under the N3B contract which included the handling of solid radioactive waste to support transuranic waste shipments
- Dose remained steady at SRS as innovations such as using drones in post closure areas and optimization process projects in support of K area plutonium down blend helped to reduce radiological exposure
- At ORNL, CY 2019 saw a decrease in dose for project work at the research reactor and accelerator facilities. The decrease was partially offset by an increase in dose at radiochemistry, and some hot cell facilities.
- For Hanford site, work restarted at the plutonium finishing plant in CY 2019 and additional work at the 324 Building. Both of these activities involved planned long work hours located in areas with elevated external dose rates.
- The CY 2019 overall dose for WVDP decreased from the previous year due primarily to fewer manned-entries in high dose rate areas in the Main Plant, and the completion of open air demolition activities of the Vitrification Facility.
- At SRNL, the increase in dose was primarily due to the implementation of system upgrades and lab modifications. The SRNL ream completed set-up of TRU Waste Assay System upgrade which includes features such as increased efficiency in handling TRU waste drums, decreased dose exposure to workers, elimination of the use of liquid nitrogen, and uninterrupted power supply, and compliance with SRNL Documented Safety Analysis (DSA) upgrades.
- The decrease in collective dose in CY 2019 for PNNL reflects an overall lower volume of elevated risk, high dose radiological work.
- In CY 2019, UMTRA added about 30 additional staff and doubled its production in CY 2019 (increasing from shipping railcars twice a week to four times a week) which attributed to the increase in dose.
- Fermi had a planned shutdown between July and September 2019, to upgrade and repair facilities.
- Increase in the CY 2019 at PGDP can be attributed to the fact that the plant became operational again after a long-term shutdown and fluctuating production rates and line status prior to CY 2018. The plant became operational and began to increase production towards the end of CY 2018.
2020
Sites
- In CY 2020, the Pantex Dosimetry program experienced a failure of the thermoluminescent (e.g., TLD) reading equipment, resulting in the first 3 quarters of dosimeter readings in 2020 being processed at another facility. Due to differences between the thermoluminescent dosimeter readers used, dose calculations were corrected for the reader differences, and a very conservative approach was utilized to ensure all dose was captured. As a result, the dose for Pantex personnel was elevated compared to prior years.
- Idaho changed from a quarterly to a semi-annual dosimeter exchange period.
- UMTRA attributed an increase in dose to a 50 percent greater (on average) concentration of radium-226 in the excavated mill tailings and additional time spent in the contamination area training new employees.
- While Fermilab was shut down for four months during the COVID-19 pandemic, upgrades and repairs were completed to prepare the accelerator and associated facilities for new experiments at much higher beam intensities. These activities resulted in an 11.2 percent increase in dose from CY 2019.
- PORTS began issuing new dosimeters. These new TLDs have a greater sensitivity at low levels of radiation resulting in a greater number of positive readings above the minimum reportable dose.
Geopolitical
- COVID-19 pandemic led many DOE sites across the complex to decrease radiological work.
2021
Sites
-
In CY 2021, there was an increase in work at TA-55, leading to an increase in the number of personnel, and subsequently, an increase in collective dose at LANL.
-
Idaho began work on waste drum characterization and increased entries in the fuel storage facility and other high dose areas.
-
Pantex resolved their dosimetry issue and dose levels were similar to CY 2019.
-
Energy Technology Engineering Center eliminated personnel dosimeters due to no accessible radiological areas present onsite.
-
UMTRA decreased the quantity of tailings shipped by 10 percent.
Policy
- DOE projects monumental emissions reduction from Inflation Reduction Act.
Geopolitical
- As the COVID-19 pandemic began to lessen, many DOE sites slowly resumed radiological work.
2022
Sites
-
In CY 2022, there was an increase in work at LANL TA-55, leading, to an increase in the number of personnel, and subsequently, an increase in collective dose.
-
The deactivation of 235-F was completed at Savannah River; post-closure care activities performed at closed reactor facilities; and plutonium down blending in area K which was completed ahead of schedule in FY 2022.
-
Work at West Valley Demonstration Project in an area exhibiting very high radiation levels that could not be reduced through conventional ALARA work strategies started in CY 2021, continued through most of CY 2022.
-
At Fermi National Accelerator Laboratory (Fermilab), the majority of dose to personnel resulted from work performed during the shutdown from June 11 to November 13 of CY 2022.
Geopolitical
- Most DOE sites have resumed radiological work as the effects of COVID-19 pandemic continued to lessen.
2023
Sites
-
In CY 2023, there was an atypical reduction in demand of programmatic heat source work, which contributed greatly to the observed reduction in dose at Los Alamos National Laboratory.
-
Dose at Savannah River Site increased in CY 2023 as the site set a single-year record by processing nearly 3.2 million gallons of radioactive salt waste. Also, two radioactive structures in the F Tank Farm were successfully closed and grouted.
-
The Portsmouth facility restarted plant operations in June 2022 with a graded restart from one operational line up to three during CY 2023 as operations returned to full production. The dose is as expected and typical for 3 lines operating.
2024
Sites
-
The Surplus Plutonium Disposition Team at Savannah River Site received approval from the Department of Energy to expand down blending capabilities in the K Area Complex.
-
The decrease in TED at Lawrence Livermore National Laboratory for CY 2024 was primarily due to a work pause impacting individuals expected to receive high doses.
-
Hanford: Office of River Protection had a significant dose reduction in CY 2024 due to a technology change introduced in tank farm activities.
-
West Valley Demonstration Project completed demolition of the Main Plain Process Building.
Geopolitical
-
The US Department of Energy has released an information guide for communities considering replacing their retired or retiring coal power plants with nuclear power plants. The guide is based on a technical study that found transitioning from a coal plant to nuclear would bring local benefits including employment opportunities, increased revenues and economic activity.
-
Tohuku Electric Power Company's Onagawa unit 2 is the first Japanese boiling water reactor to be restarted since the earthquake and tsunami of March 2011.
-
Japan announced in April 2021 it planned to discharge water into the sea over a period of about 30 years. It started to discharge the water on 24 August 2024 and has so far completed the release of eight batches, a total of 62,400 cubic meters of water. The releases were treated by the Advanced Liquid Processing System, which removes most of the radioactive contamination, with the exception of tritium which is currently stored in tanks on site.